Products
SentimenTrader Trading Tools
‍
Backtest Engine
My Trading Toolkit
Correlation Analysis
Seasonality
Market Prediction
Indicators & Data API
‍
Proprietary Indicators & Charts
Market Data API
Strategies & Scanner
‍
50+ Trading Strategies
Smart Stock Scanner
Smart Option Scanner
Research Reports
‍
Research Solutions
Reports Library
Free Resources
Simple Backtest Calculator
Simple Seasonality Calculator
The Kelly Criterion Calculator
Sentiment Geo Map
Public Research Reports
Education
Sentiment Indicators
Technical Indicators
Pricing
Company
About
In the News
Testimonials
Client Success Stories
Contact
Log inLoginSign up
< BACK TO ALL REPORTS

Is seven straight up weeks a good thing or a bad thing?

Jay Kaeppel
2026-05-18
The S&P 500 just registered its seventh consecutive weekly gain. Is it a sign of a powerful trend? Or have things gone too far, and are we due for a pullback? To answer those questions, we examine the history herein.

Key points:

  • The S&P 500 registered its seventh consecutive up week on May 15th
  • This has happened only 37 times since the 1920s
  • The common perception/concern is that a run of this magnitude (almost two straight months of higher weekly closes) may constitute action resembling a blow-off top
  • History appears to say something different

The S&P 500 has been on a heater

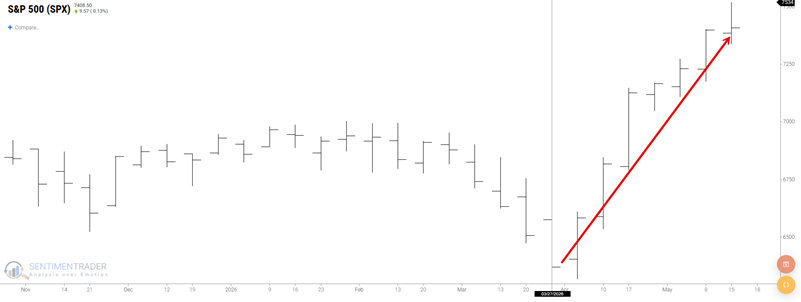
From January 30th through March 27th, the S&P 500 declined 7 out of 8 weeks, losing -8.2% in the process. With fears of war, higher energy costs, and inflation swirling, things looked fairly dire. However, since then, the S&P 500 has registered 7 consecutive higher weekly closes, soaring 16.3% in the process, to a new all-time high.
Is seven straight up weeks a good thing or a bad thing?

Interestingly, the overall response has been something less than enthusiastic. The rally has completely confounded existing market bears, and now there is chatter of a "blow-off" top. But what does history say about a 7-week rally? Let's take a closer look.

Seven straight weekly advances tend to beget more strength

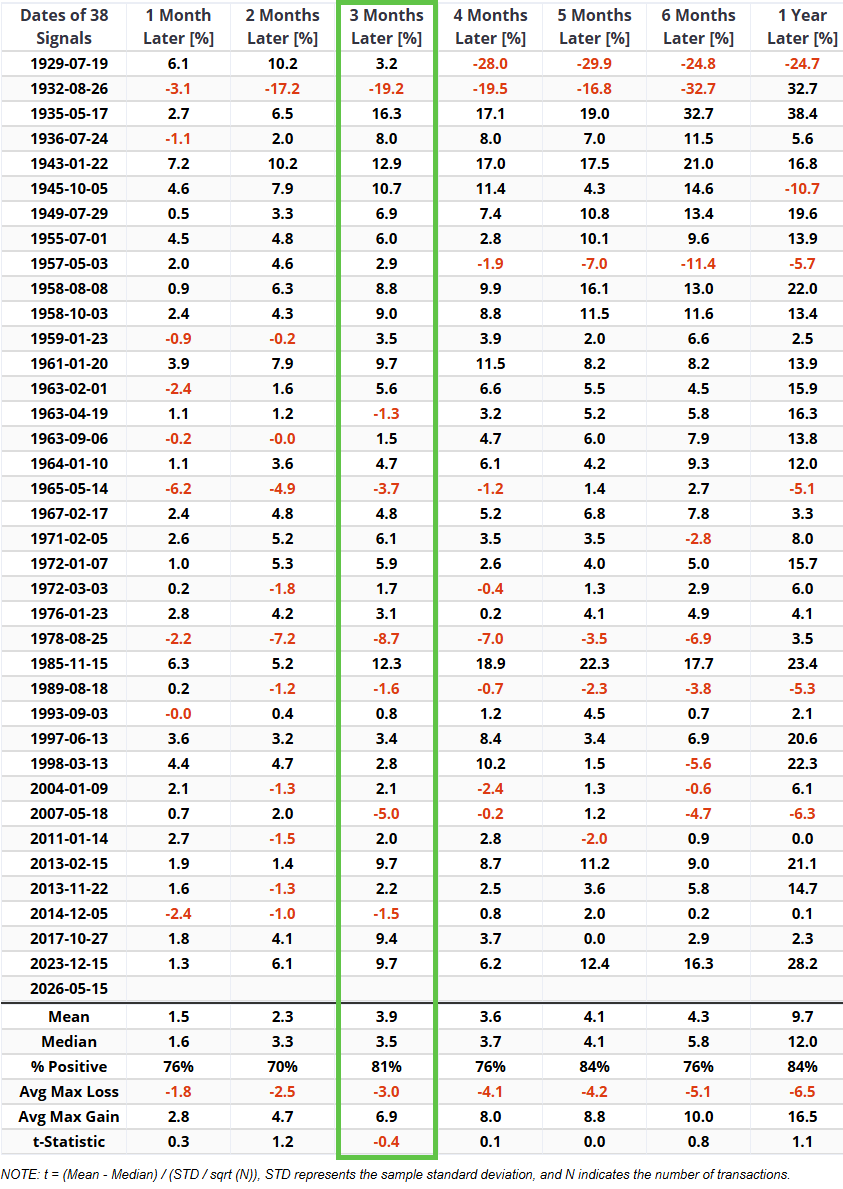
Our test period runs from January 2nd, 1928, through May 15th, 2026, or almost 98.5 years. The table below lists every time the S&P 500 advanced for consecutive weeks following at least one down week and summarizes subsequent S&P 500 performance.
Is seven straight up weeks a good thing or a bad thing?

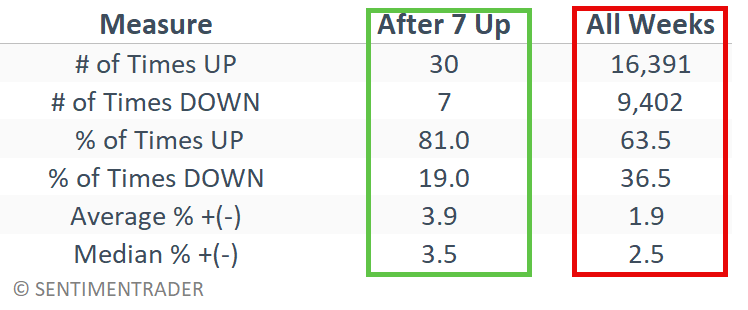
Note that 3 months shows an 81% Win Rate, with a Mean return of 3.9% and a Median return of 3.5%. How does this compare to "all" three-month periods since 1928? The table below summarizes S&P 500 performance following seven consecutive up weeks versus all three-month periods since 1928.
Is seven straight up weeks a good thing or a bad thing?

Note that the win rates and returns following seven straight up weeks are well above average.

Seven straight weekly advances as a trading strategy

For the sake of argument, let's consider "Seven Up Weeks (with a 3-month holding period)" as a standalone trading strategy.

If the S&P 500 closes higher for seven consecutive weeks:

  • Buy the S&P 500 Index
  • Hold for 63 trading days
  • A stop-loss of 12% is also included to avoid any catastrophic losses

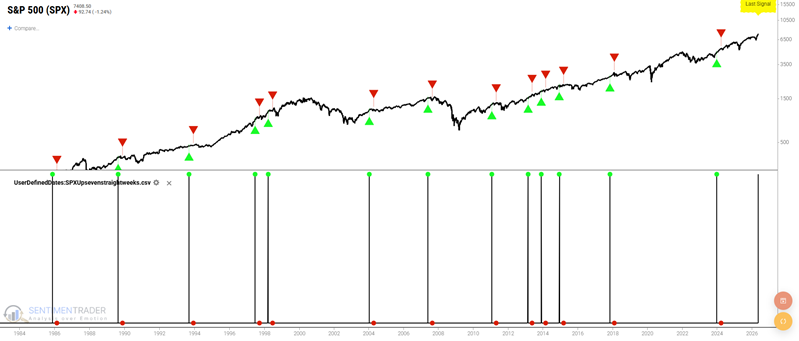
The chart below shows all signals since the 1980s. Note that the signal historically does not fire during a bear market rally, nor (so far) just before the onset of a major bear market.
Is seven straight up weeks a good thing or a bad thing?

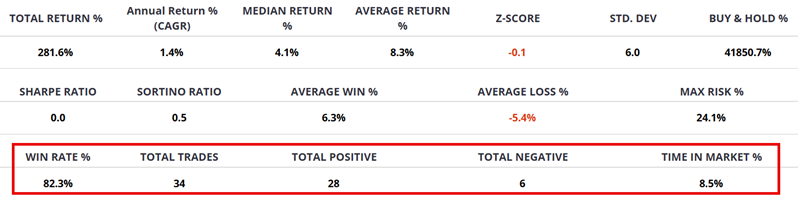
The table below summarizes cumulative S&P 500 performance if held for three months after each signal.
Is seven straight up weeks a good thing or a bad thing?

Note that this "strategy" (such as it is) is only in the market 8.5% of the time and has shown an 82.3% Win Rate.

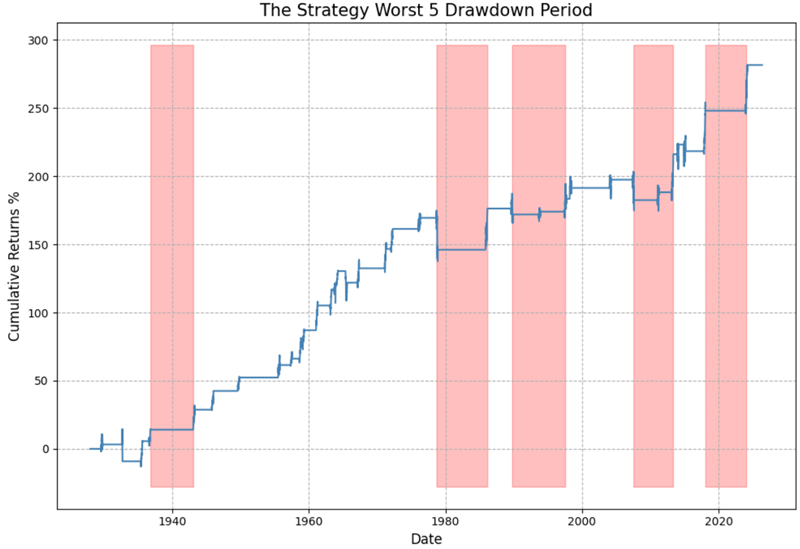
The chart below shows the hypothetical cumulative % gain/loss following the rules above. Note that although the strategy is by no means impervious to declines, the overall trend is steadily from lower left to upper right.
Is seven straight up weeks a good thing or a bad thing?

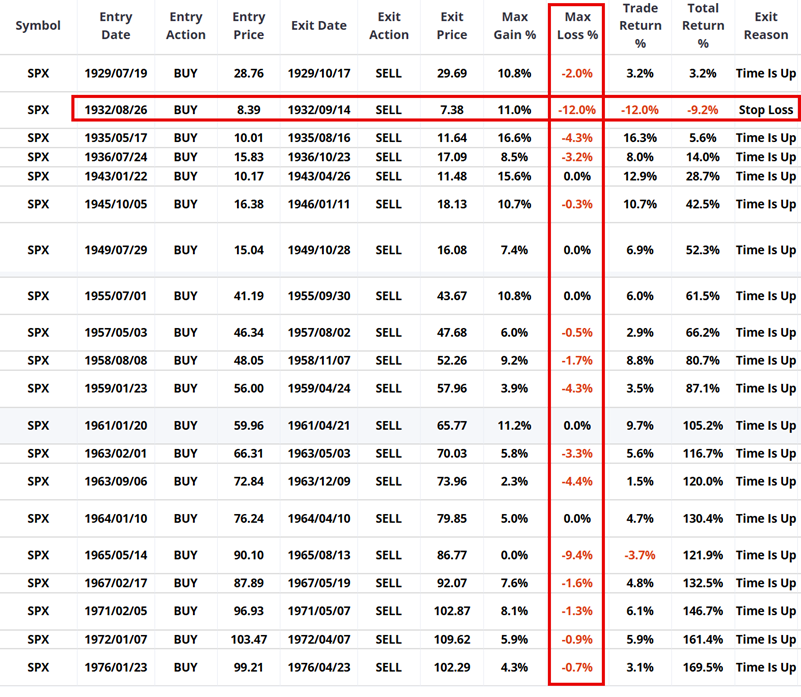
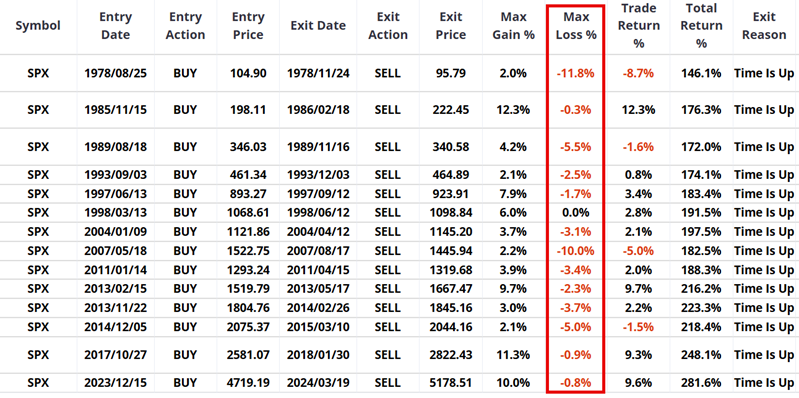
The tables below show performance on a signal-by-signal basis. The maximum open loss from the entry price is highlighted in red. Note that (so far) only one trade (August 6, 1932) declined enough within three months of entry to trigger a stop-loss of -12.0%.
Is seven straight up weeks a good thing or a bad thing?

Is seven straight up weeks a good thing or a bad thing?

What the research tells us…

Do seven consecutive weeks of advance for the S&P 500 Index truly constitute a "Buy" signal? That's up to each trader to decide for themselves. Should traders be trading long the S&P 500 Index between now and mid-July based on this signal? Same answer. Whether the signal generated on May 15th will generate a gain or a loss in the months ahead is impossible to predict. The key point of this note is simply to highlight that "strength tends to beget strength" in the stock market. While we should never throw caution to the wind, we should not fear market strength.

PRODUCTS
SentimenTrader
Trading Tools
Indicators & Data API
‍
Strategies & Scanner
‍
Research Reports
FREE
RESOUrCES
Simple Backtest
Calculator
Simple Seasonality
Calculator
The Kelly Criterion
Calculator
Sentiment Geo Map
‍
Public Research Reports
‍
Education
Sentiment Indicators
‍
Technical Indicators
‍
Pricing
Bundle pricing
‍
FAQ
‍
Announcements
‍
COMPANY
‍
About
‍
In the News
‍
Testimonials
‍
Client Success Stories
CONTACT
‍
General Inquiries
‍
Media Inquiries
‍
Financial Professionals Inquiries
‍
© 2026 Sundial Capital Research Inc. All rights reserved.
Setsail Marketing
TermsPrivacyAffiliate Program
Risk Disclosure: The information and tools provided are for research and analytical purposes only and are not intended as investment advice. Market analysis involves uncertainty, and outcomes may differ from expectations. Users should conduct their own due diligence and consider their individual circumstances before making any financial decisions. Past performance is not necessarily indicative of future results.

Hypothetical Performance Disclosure: Hypothetical performance results have many inherent limitations, some of which are described below. No representation is being made that any account will or is likely to achieve profits or losses similar to those shown; in fact, there are frequently sharp differences between hypothetical performance results and the actual results subsequently achieved by any particular trading program. One of the limitations of hypothetical performance results is that they are generally prepared with the benefit of hindsight. In addition, hypothetical trading does not involve financial risk, and no hypothetical trading record can completely account for the impact of financial risk of actual trading. for example, the ability to withstand losses or to adhere to a particular trading program in spite of trading losses are material points which can also adversely affect actual trading results. There are numerous other factors related to the markets in general or to the implementation of any specific trading program which cannot be fully accounted for in the preparation of hypothetical performance results and all which can adversely affect trading results.

Testimonial Disclosure: Testimonials appearing on this website may not be representative of other clients or customers and is not a guarantee of future performance or success.