Products
SentimenTrader Trading Tools
‍
Backtest Engine
My Trading Toolkit
Correlation Analysis
Seasonality
Market Prediction
Indicators & Data API
‍
Proprietary Indicators & Charts
Market Data API
Strategies & Scanner
‍
50+ Trading Strategies
Smart Stock Scanner
Smart Option Scanner
Research Reports
‍
Research Solutions
Reports Library
Free Resources
Simple Backtest Calculator
Simple Seasonality Calculator
The Kelly Criterion Calculator
Sentiment Geo Map
Public Research Reports
Education
Sentiment Indicators
Technical Indicators
Pricing
Company
About
In the News
Testimonials
Client Success Stories
Contact
Log inLoginSign up
< BACK TO ALL REPORTS

Is it Time for a Seasonal Bounce in Real Estate?

Jay Kaeppel
2025-12-18
The last five trading days of the year have historically shown a favorable trend. The real estate sector has been the top-performing sector during this short window since 1927. Is it worth a look despite lagging results for most of the year? We report, you decide.

NOTE: I am away this week, but have chosen to revisit a few timely notes from the archive. Please note that the results below DO NOT include values for 2024. For the record, in 2024, during the seasonal period detailed below, the S&P 500 Real Estate sector gained 0.34%. The ticker XLRE gained 0.32%, and ticker DRN gained 0.41%.

Key Points

  • Of the 11 S&P 500 sectors, the real estate sector has been the top performer during the last five trading days of the year
  • Consistency and downside risk are vital considerations that we will examine
  • ETFs offer traders the potential to play this long-term year-end trend

Real Estate - Last five trading days of the year

For 2025, the last five trading days begin at the close on December 23rd and end at the close on December 31st.

For our test, we will use index data going back to 1927. Before 1990, we used the Fama-French real estate sector data series. Starting in 1990, we used the S&P 500 Real Estate sector data series.

NOTE: The charts and tables below do NOT include 2024 results.

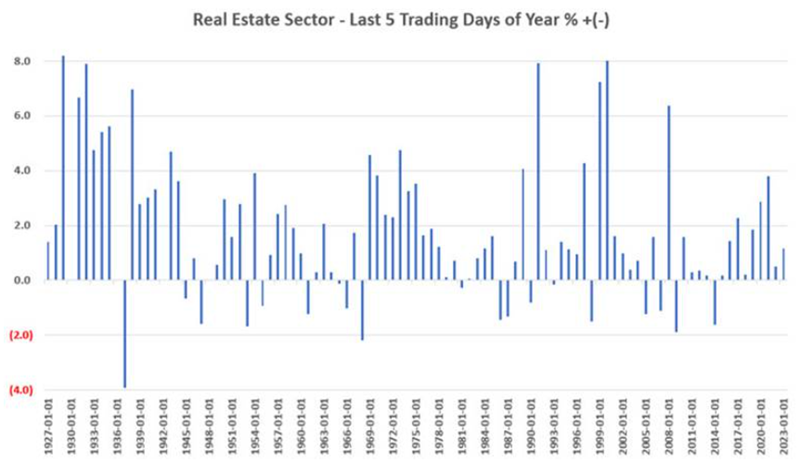
The chart below displays the index's year-by-year % return if held ONLY during each calendar year's final five trading days.

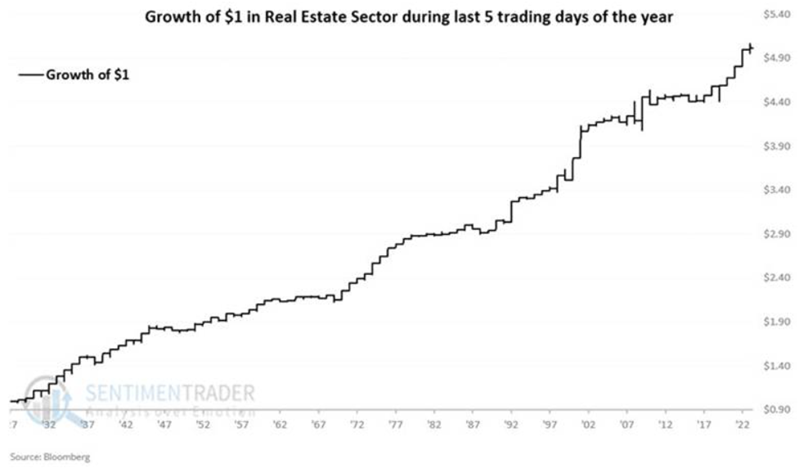
The chart below displays the cumulative growth of $1 if invested in the index ONLY during each calendar year's final five trading days.

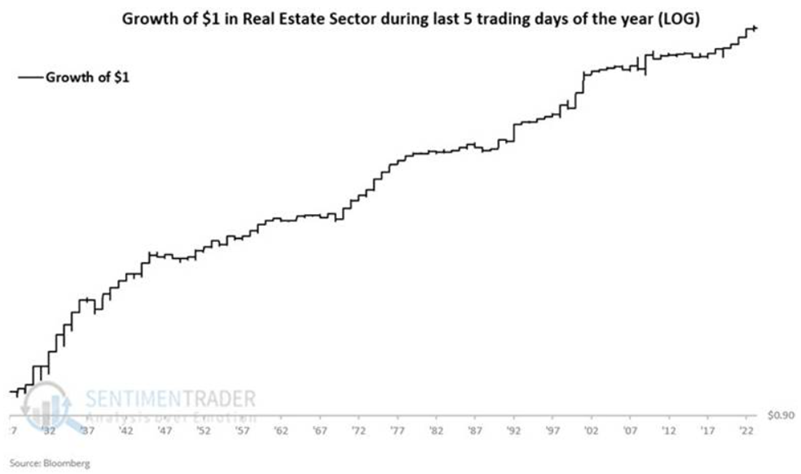
The chart below displays the same results on a logarithmic scale.

The summary of results shows that 76% of these windows were positive, with an average and maximum gain that was well above the average and maximum decline.

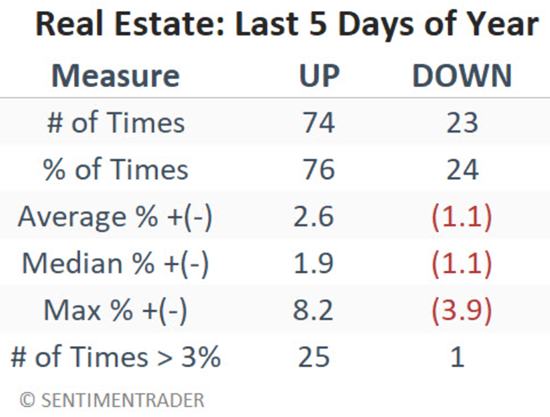
Two positives to note:

  • The maximum historical decline during this period for the real estate index was a seemingly manageable -3.9%
  • Moves of 3% or more have skewed to the positive side by a factor of 25 to 1

These factors suggest a favorable reward-to-risk tradeoff.

Actual trading considerations

The most straightforward way to capitalize on this trend is to purchase shares of an ETF. The Real Estate Select Sector SPDR Fund (XLRE) tracks the S&P 500 Real Estate Sector Index.

Another more aggressive approach involves ticker DRN, a 3x leveraged ETF that tracks the MSCI Investable Real Estate Index. The leverage means greater profit potential but also a greater risk of loss. Longer-term positions in 3x funds are fraught with peril. However, short-term trades such as the 5-day period we are discussing here can offer a trader who understands the risk the potential to magnify their gains if their strategy performs as expected.

The table below displays returns for XLRE and DRN during the last five trading days of the year since the inception of each ETF.

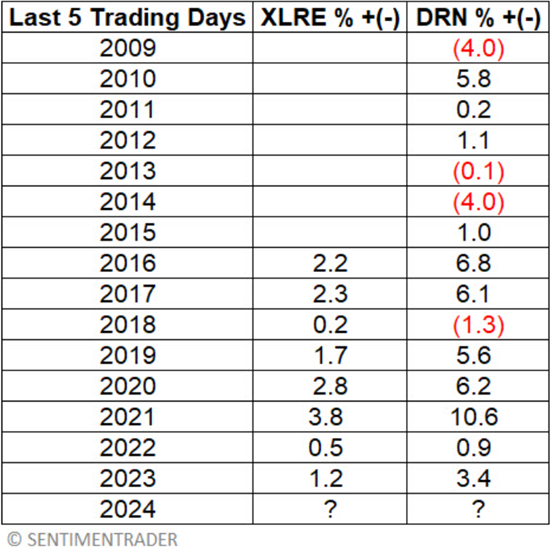
NOTE: For 2024 during this period, XLRE gained +0.340% and DRN gained +0.408%.

What the data tells us...

Of the 11 S&P 500 Index Sectors, Real Estate has been the best "last five trading days of the year" performer since 1927. The results for any given year can vary greatly. However, the Win Rate and average win-to-loss ratio have been relatively consistent over many decades. The ETF XLRE allows traders to emulate the returns of the S&P 500 Real Estate sector. ETF DRN offers the potential for leveraged gains to traders willing to take on the risks associated with leveraged funds.

PRODUCTS
SentimenTrader
Trading Tools
Indicators & Data API
‍
Strategies & Scanner
‍
Research Reports
FREE
RESOUrCES
Simple Backtest
Calculator
Simple Seasonality
Calculator
The Kelly Criterion
Calculator
Sentiment Geo Map
‍
Public Research Reports
‍
Education
Sentiment Indicators
‍
Technical Indicators
‍
Pricing
Bundle pricing
‍
FAQ
‍
Announcements
‍
COMPANY
‍
About
‍
In the News
‍
Testimonials
‍
Client Success Stories
CONTACT
‍
General Inquiries
‍
Media Inquiries
‍
Financial Professionals Inquiries
‍
© 2026 Sundial Capital Research Inc. All rights reserved.
Setsail Marketing
TermsPrivacyAffiliate Program
Risk Disclosure: The information and tools provided are for research and analytical purposes only and are not intended as investment advice. Market analysis involves uncertainty, and outcomes may differ from expectations. Users should conduct their own due diligence and consider their individual circumstances before making any financial decisions. Past performance is not necessarily indicative of future results.

Hypothetical Performance Disclosure: Hypothetical performance results have many inherent limitations, some of which are described below. No representation is being made that any account will or is likely to achieve profits or losses similar to those shown; in fact, there are frequently sharp differences between hypothetical performance results and the actual results subsequently achieved by any particular trading program. One of the limitations of hypothetical performance results is that they are generally prepared with the benefit of hindsight. In addition, hypothetical trading does not involve financial risk, and no hypothetical trading record can completely account for the impact of financial risk of actual trading. for example, the ability to withstand losses or to adhere to a particular trading program in spite of trading losses are material points which can also adversely affect actual trading results. There are numerous other factors related to the markets in general or to the implementation of any specific trading program which cannot be fully accounted for in the preparation of hypothetical performance results and all which can adversely affect trading results.

Testimonial Disclosure: Testimonials appearing on this website may not be representative of other clients or customers and is not a guarantee of future performance or success.