Products
SentimenTrader Trading Tools
‍
Backtest Engine
My Trading Toolkit
Correlation Analysis
Seasonality
Market Prediction
Indicators & Data API
‍
Proprietary Indicators & Charts
Market Data API
Strategies & Scanner
‍
50+ Trading Strategies
Smart Stock Scanner
Smart Option Scanner
Research Reports
‍
Research Solutions
Reports Library
Free Resources
Simple Backtest Calculator
Simple Seasonality Calculator
The Kelly Criterion Calculator
Sentiment Geo Map
Public Research Reports
Education
Sentiment Indicators
Technical Indicators
Pricing
Company
About
In the News
Testimonials
Client Success Stories
Contact
Log inLoginSign up
< BACK TO ALL REPORTS

Is Consumer Confidence the Ultimate Contrarian Indicator?

Jay Kaeppel
2025-10-06
With the stock market soaring, one might expect consumer confidence to be high. But that is not the case, as consumer confidence lingers near historic lows. Is that a bad thing? It depends on whether you are primarily invested in stocks or bonds. Details herein.

Key points:

  • Consumer confidence measures tend to be useful contrarian indicators
  • Plunges in consumer confidence are reported in the news as ominous warnings
  • Few understand the implications of low confidence for stocks and bonds

University of Michigan Consumer Confidence has plunged (Hooray for stock owners!)

If you listen to a financial news talk show host discuss low consumer confidence, you will hear it in hushed tones, couched in ominous warnings of impending fear and loathing and tough times ahead. Of course, this entirely ignores the contrarian nature of investor and consumer sentiment.

The chart below highlights those rare occasions when the University of Michigan Consumer Confidence survey crossed below 56%. The most recent signal occurred on September 30th.

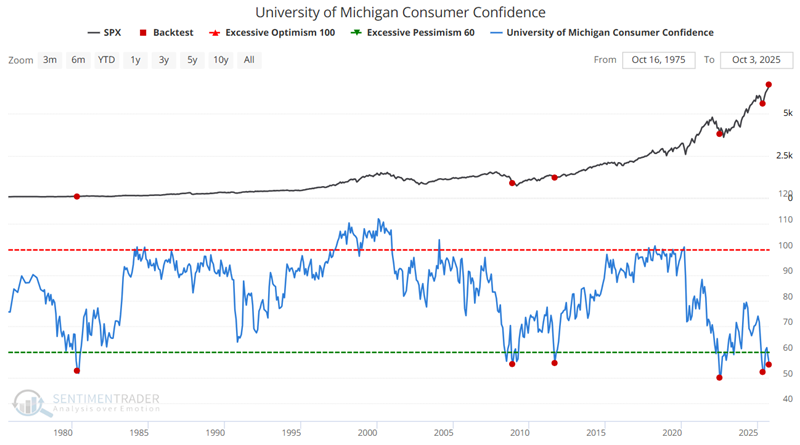
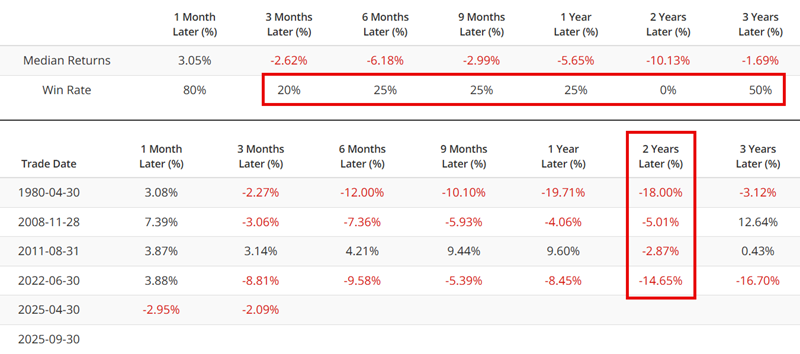
Does anything jump out at you just from eyeballing the chart above? The table below quantifies the performance of the S&P 500 index following the signal dates highlighted in the chart above.

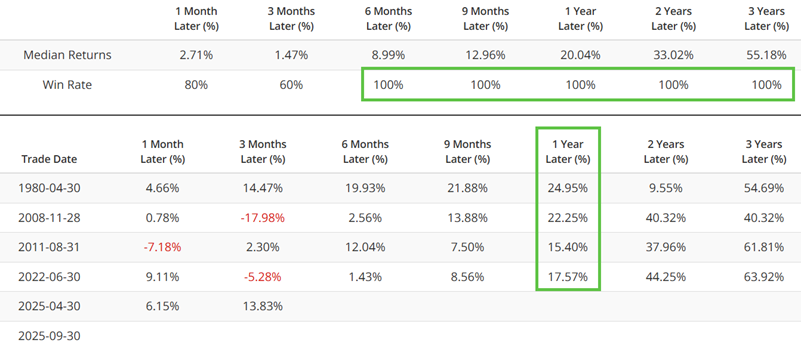
While no signal is ever guaranteed to work "this time around," the results in the table above are "compelling."

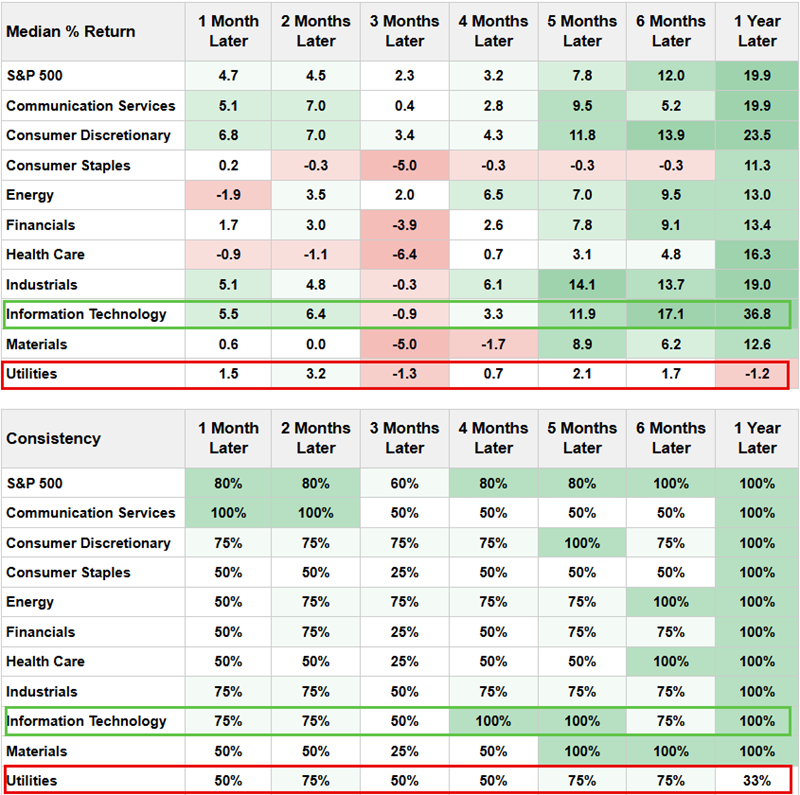
The table below displays performance for the various S&P 500 sectors following the signal dates. While much is to be gleaned, the most compelling item is the stark difference in performance between Technology (100% twelve-month Win Rate and 36.8% Median Return) and Utilities (33% twelve-month Win Rate and -1.2% Median Return).

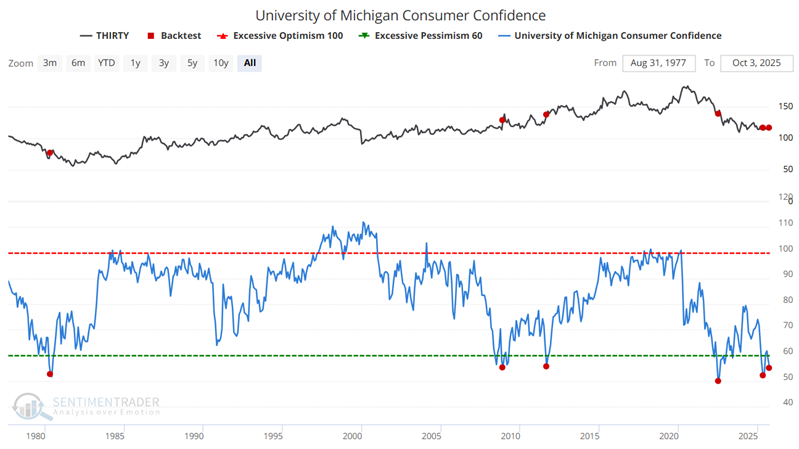
University of Michigan Consumer Confidence has plunged (Bond buyers beware!)

Low consumer confidence readings raise the specter of a poor economy. Many expect an impending decline in economic growth to be accompanied by declining interest rates. Ergo, the conventional wisdom surrounding low consumer confidence is that bonds will perform well. How has this theory held up in reality?

The chart below highlights those rare occasions when the University of Michigan Consumer Confidence survey crossed below 56% with the thirty-year treasury bond futures contract as the relevant index. The most recent signal occurred on September 30th.

The table below quantifies the performance of thirty-year treasury bond futures following the signal dates highlighted in the chart above.

Once again, there is no guarantee that t-bonds will decline in the months and years ahead. That said, this indicator suggests avoiding a significant commitment to long-term treasury bonds at this time.

What the research tells us…

The most compelling argument for using sentiment to analyze the financial markets is that human nature is the one constant. Fear and greed are universal human emotions. When they reach an extreme, the attendant groupthink gets turned on its head, and the market (typically) looks the other way. The reactions of the stock and bond markets to the extreme in consumer confidence detailed above are a classic case in point. While the end-of-September reading in the U of M Consumer Confidence survey does not guarantee higher stock prices and/or lower bond prices in the year ahead, the results highlighted strongly suggest giving stocks the benefit of the doubt, much more so than the bond market.

PRODUCTS
SentimenTrader
Trading Tools
Indicators & Data API
‍
Strategies & Scanner
‍
Research Reports
FREE
RESOUrCES
Simple Backtest
Calculator
Simple Seasonality
Calculator
The Kelly Criterion
Calculator
Sentiment Geo Map
‍
Public Research Reports
‍
Education
Sentiment Indicators
‍
Technical Indicators
‍
Pricing
Bundle pricing
‍
FAQ
‍
Announcements
‍
COMPANY
‍
About
‍
In the News
‍
Testimonials
‍
Client Success Stories
CONTACT
‍
General Inquiries
‍
Media Inquiries
‍
Financial Professionals Inquiries
‍
© 2026 Sundial Capital Research Inc. All rights reserved.
Setsail Marketing
TermsPrivacyAffiliate Program
Risk Disclosure: The information and tools provided are for research and analytical purposes only and are not intended as investment advice. Market analysis involves uncertainty, and outcomes may differ from expectations. Users should conduct their own due diligence and consider their individual circumstances before making any financial decisions. Past performance is not necessarily indicative of future results.

Hypothetical Performance Disclosure: Hypothetical performance results have many inherent limitations, some of which are described below. No representation is being made that any account will or is likely to achieve profits or losses similar to those shown; in fact, there are frequently sharp differences between hypothetical performance results and the actual results subsequently achieved by any particular trading program. One of the limitations of hypothetical performance results is that they are generally prepared with the benefit of hindsight. In addition, hypothetical trading does not involve financial risk, and no hypothetical trading record can completely account for the impact of financial risk of actual trading. for example, the ability to withstand losses or to adhere to a particular trading program in spite of trading losses are material points which can also adversely affect actual trading results. There are numerous other factors related to the markets in general or to the implementation of any specific trading program which cannot be fully accounted for in the preparation of hypothetical performance results and all which can adversely affect trading results.

Testimonial Disclosure: Testimonials appearing on this website may not be representative of other clients or customers and is not a guarantee of future performance or success.