Data &
Technology
Research
Reports
Report Solutions
Reports Library
Actionable
Strategies
Free
Resources
Simple Backtest Calculator
Simple Seasonality Calculator
The Kelly Criterion Calculator
Sentiment Geo Map
Public Research Reports
Free Webinar
Pricing
Company
About
Meet Our Team
In the News
Testimonials
Client Success Stories
Contact
Log inLoginSign up
< BACK TO ALL REPORTS

IPOs enter a bear market in major divergence with "the market"

Jason Goepfert
2021-03-29
For only the 2nd time in history, the S&P 500 is within days of a 52-week high while an index of recently IPOs is down more than 20%.

From Dean...

With the air coming out of some of the more speculative pockets of the market, now is an excellent time to remember the following thought...with great reward comes significant risk.

With IPO, SPAC, Solar, and other speculative stocks down on a peak to trough basis of greater than 20%, let's see how that compares to the technology bubble in the mid to late 1990s.


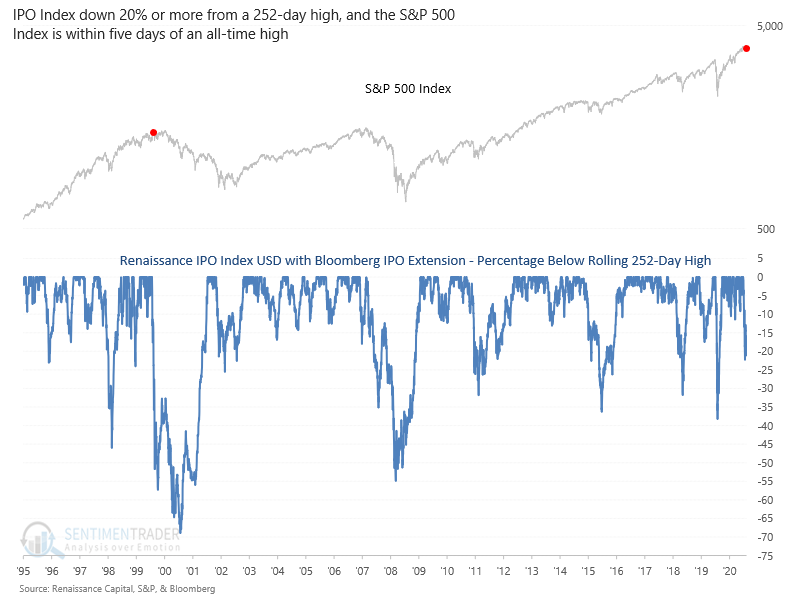
The Renaissance IPO index closed down more than 20% from its most recent high last week even as the S&P 500 was less than five days from a new all-time high. As the chart above shows, this is the second instance in history. With n=2, this isn't to make any dire predictions; it's merely an observation.

What else we're looking at

  • A more comprehensive look at other risk-based indexes and their recent drawdowns
  • Taking an in-depth look at structuring an options trade to capture upside but minimize the risk of deflating volatility

Stat Box

The median return in Technology stocks in the 2nd year after a bear market bottom has been 14.4%. That doesn't sound too bad, but it's the 2nd-lowest median return out of any major sector.


Etcetera

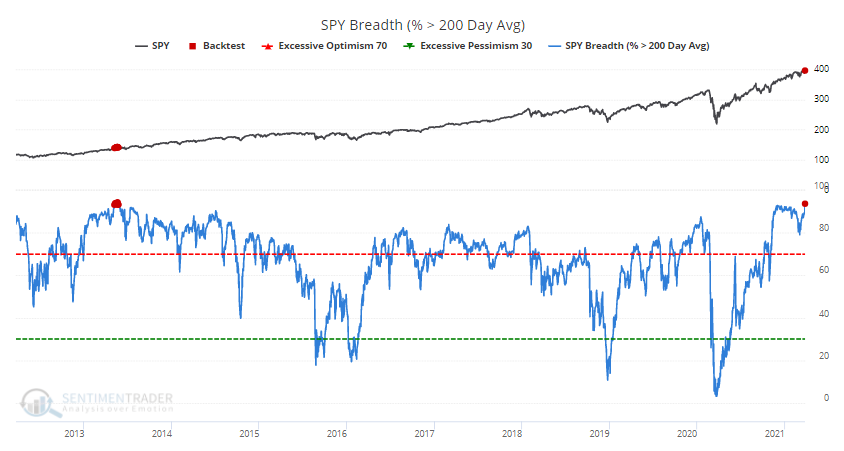
Most uptrends in 8 years. More than 93% of S&P 500 stocks are now trading above their 200-day moving averages. That's the most stocks in long-term uptrends since 2013.

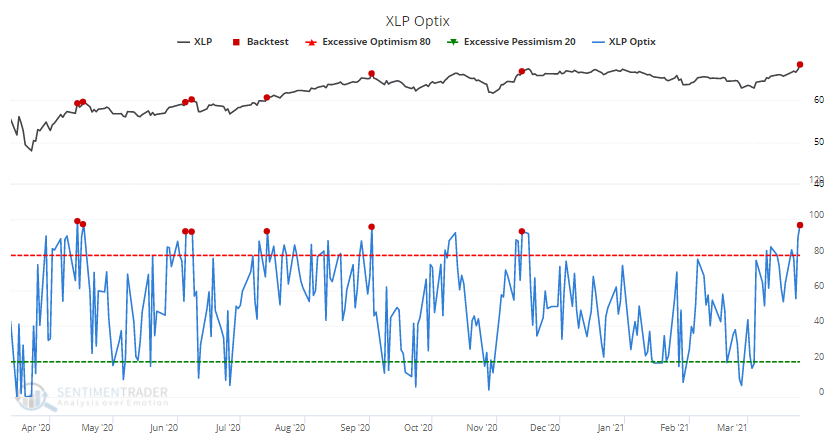
Bears get stapled. Sentiment on the Consumer Staples fund, XLP, has spiked to one of the highest levels in a year, and the highest Optimism Index since November.

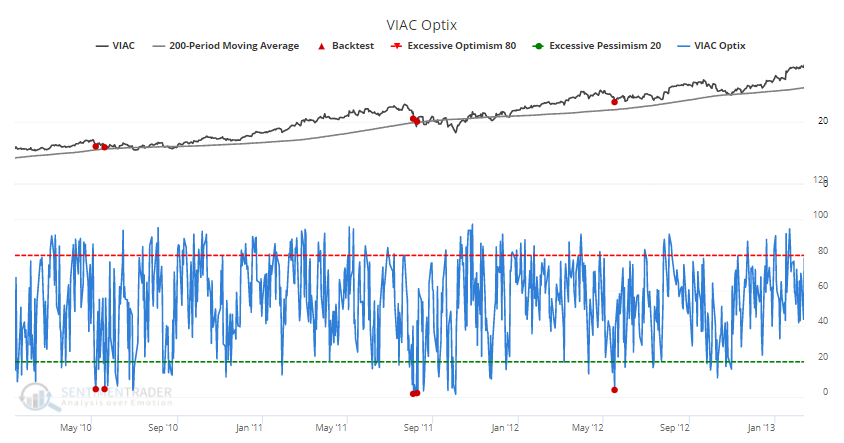
Not very entertaining. Traders had been riding stocks like Viacom over the past year, then suddenly...not. A screen of stocks trading above their 200-day averages but with low optimism brought Viacom to the top of the list. In its history, our Backtest Engine shows only 5 other days with an Optimism Index below 5% while the stock was in an uptrend, all triggering from 2010 - 2012.

DATA &
TECHnologies
IndicatorEdge
‍
BackTestEdge
‍
Other Tools
‍
DataEdge API
RESEARCH
reports
Research Solution
‍
Reports Library
‍
actionable
Strategies
Trading Strategies
‍
Smart Stock Scanner
‍
FREE
RESOUrCES
Simple Backtest
Calculator
Simple Seasonality
Calculator
The Kelly Criterion
Calculator
Sentiment Geo Map
‍
Public Research Reports
‍
Free Webinar
COMPANY
‍
About
‍
Meet our Team
‍
In the News
‍
Testimonials
‍
Client Success Stories
Pricing
Bundle pricing
‍
Announcements
‍
FAQ
© 2024 Sundial Capital Research Inc. All rights reserved.
Setsail Marketing
TermsPrivacyAffiliate Program
Risk Disclosure: Futures and forex trading contains substantial risk and is not for every investor. An investor could potentially lose all or more than the initial investment. Risk capital is money that can be lost without jeopardizing ones’ financial security or life style. Only risk capital should be used for trading and only those with sufficient risk capital should consider trading. Past performance is not necessarily indicative of future results.

Hypothetical Performance Disclosure: Hypothetical performance results have many inherent limitations, some of which are described below. No representation is being made that any account will or is likely to achieve profits or losses similar to those shown; in fact, there are frequently sharp differences between hypothetical performance results and the actual results subsequently achieved by any particular trading program. One of the limitations of hypothetical performance results is that they are generally prepared with the benefit of hindsight. In addition, hypothetical trading does not involve financial risk, and no hypothetical trading record can completely account for the impact of financial risk of actual trading. for example, the ability to withstand losses or to adhere to a particular trading program in spite of trading losses are material points which can also adversely affect actual trading results. There are numerous other factors related to the markets in general or to the implementation of any specific trading program which cannot be fully accounted for in the preparation of hypothetical performance results and all which can adversely affect trading results.

Testimonial Disclosure: Testimonials appearing on this website may not be representative of other clients or customers and is not a guarantee of future performance or success.