
Investors suffer the first real pullback in months

Key points:
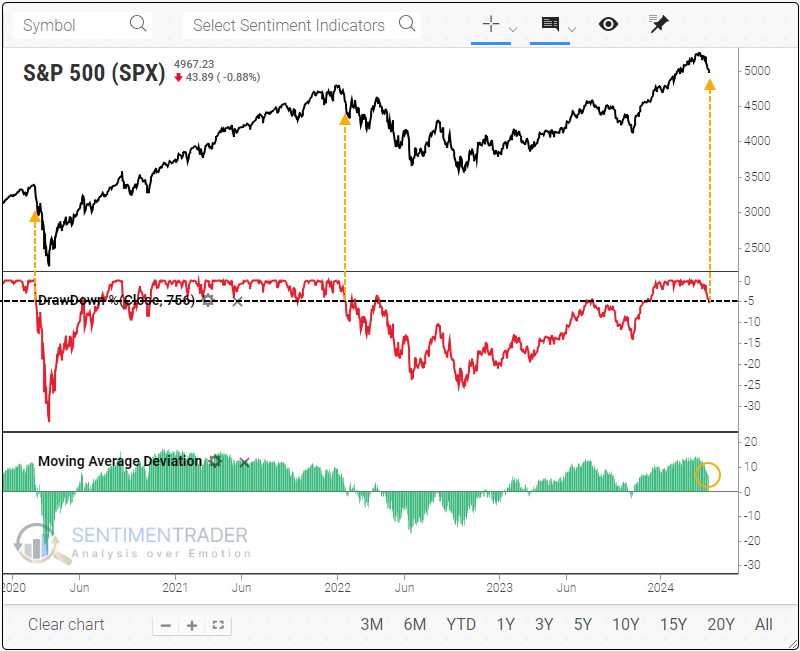
- The S&P 500 suffered its first pullback of 5% or more in months
- After record highs, this pullback has been quick, though the index remains well above its 200-day average
- Similar quick pullbacks after strong rallies showed a consistent tendency to rebound in the months ahead
Stocks have pulled back but remain well above trend
For the first time in six months, average investors are facing meaningful losses. The most benchmarked index in the world has finally entered pullback territory of more than 5% off its record high.
And if one wishes to cherry-pick periods of disaster, one could point to two recent initial pullbacks that spilled over into crushing losses for anyone with a short- to medium-term time frame.
There are some differences, however.
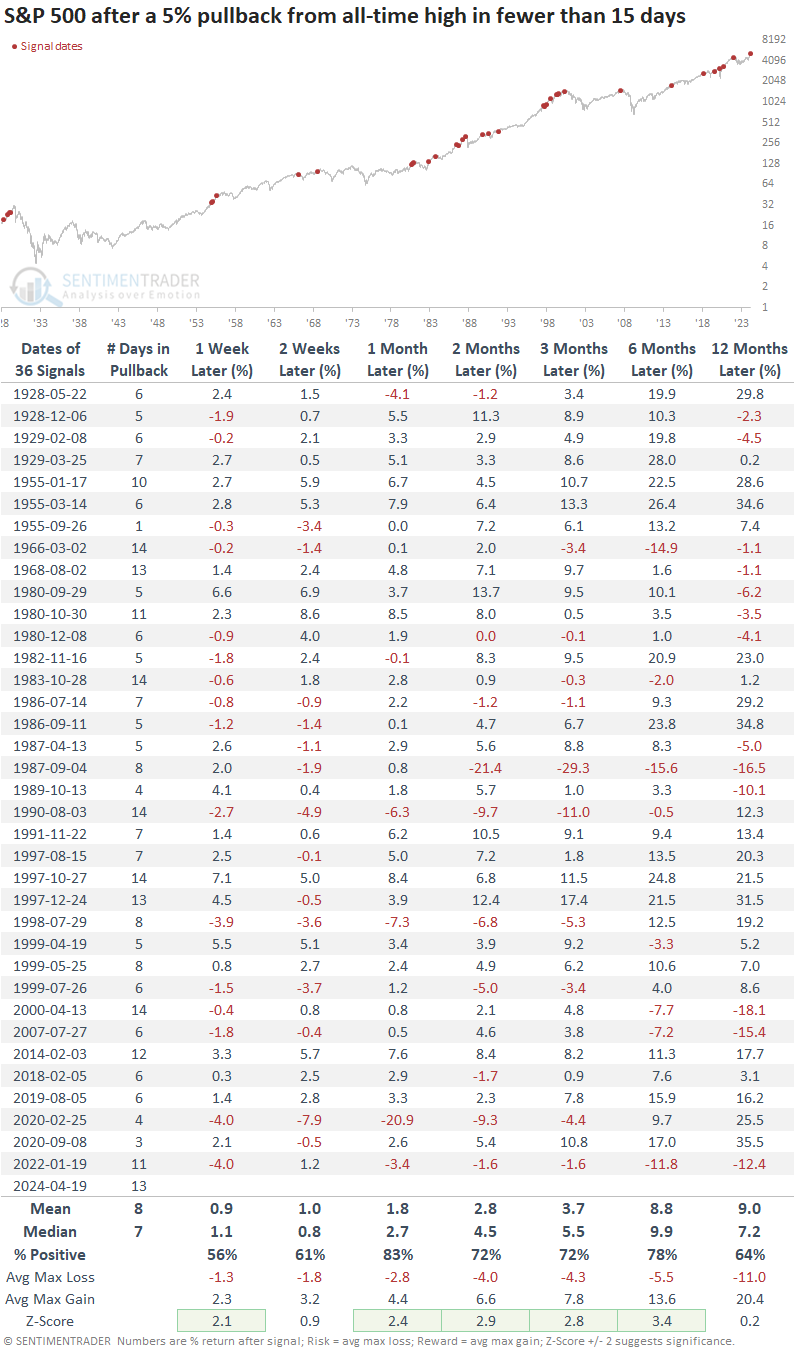
When looking at S&P 500 history since 1928, there have been 67 times when the index cycled from an all-time high to a 5% pullback. After most of those, the index recovered without too much more in the way of losses.
One wrinkle with the current pullback is that it was a bit quicker than average. The median number of days from an all-time high to a 5% pullback was 14 sessions, and the current was 13. When we look at S&P returns after quicker-than-average pullbacks, they were pretty positive, especially over the next month when it rebounded 83% of the time.
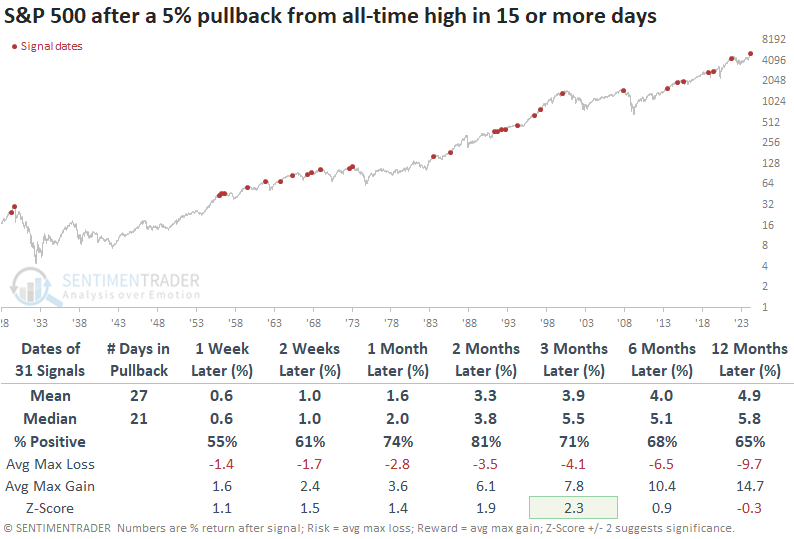
When we look at summary statistics after longer-than-average cycles from high to pullback, S&P returns were quite a bit lower over longer time frames.
What's even more notable about the current pullback is that it was quick but came from an extended run. Even after dropping 5% from its high, the index was still more than 5% above its 200-day moving average. When we further filter the quick signals to only those when the S&P was at least 5% above its average at the time of pulling back, returns improved further.
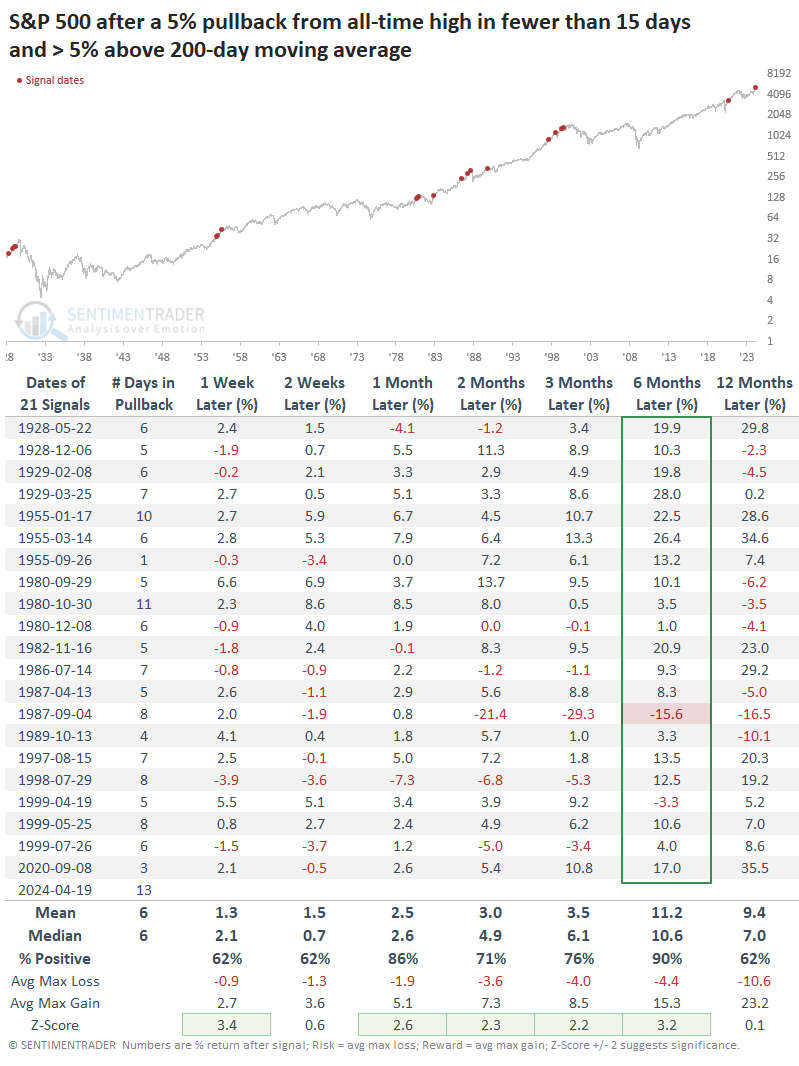
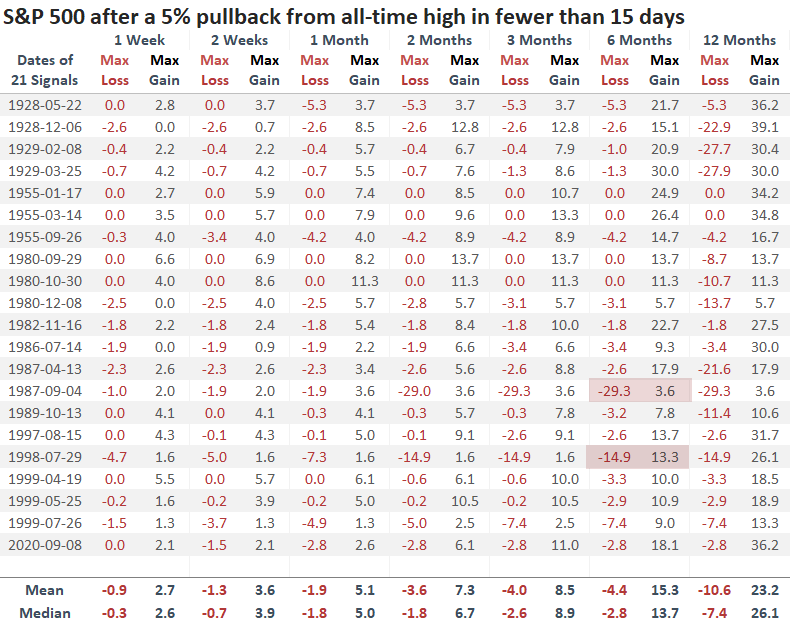
Over the next six months, the S&P rallied 19 out of 21 times. One of those losses was temporary and quickly erased, and it was positive in all earlier time frames. The only actual failure was in 1987 when the index tumbled into the Black Monday crash. So, bears could always hope for a repeat of that exception, I guess.
A table of maximum gains and losses across time frames shows that only two signals, 1987 and 1998, suffered larger losses than gains within the next six months. On average, the probability of missing out on substantial gains was significantly worse than the probability of suffering meaningful interim losses.
What the research tells us...
After month after month of low volatility and consistent gains, it's natural for investors to freak out at the first sign of a change. Our minds immediately go to the worst-case scenario, worried we missed the warning signs all along. After a miserable year like 2022, the dangers of complacency are still fresh in many minds.
When we look back at historical tendencies, however, we can see how rare it would be for anything like that to repeat. When buyers were confident and liquid enough to push stocks to record highs and well above trend, the first real pullback showed a strong tendency to attract more buyers, not sellers.