
Investor's risk tolerance shifts away from money market funds

Key points:
- Investors transitioned away from the safety of money market funds in favor of equity funds
- Similar shifts in investor's risk tolerance tended to foreshadow a bullish outcome for the S&P 500
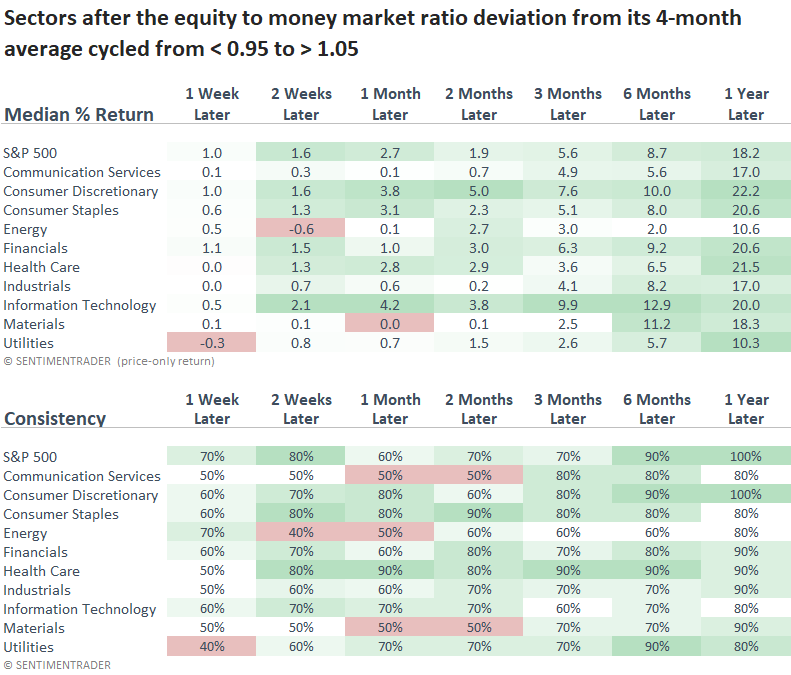
- Early-cycle cyclical sectors were more likely to outperform the S&P 500 over the subsequent year
A real money sentiment indicator triggered a buy signal for stocks
The Investment Company Institute releases monthly reports on the mutual fund industry, outlining the total assets invested in mutual funds, ETFs, and money market funds. Although the data operates with a lag, it serves as an excellent resource for grasping big-picture shifts in the mindset of investors.
When capital flows into money market funds relative to equity funds, investors are risk averse. Conversely, a shift into equity funds at the expense of money market assets signifies a more optimistic outlook from investors.
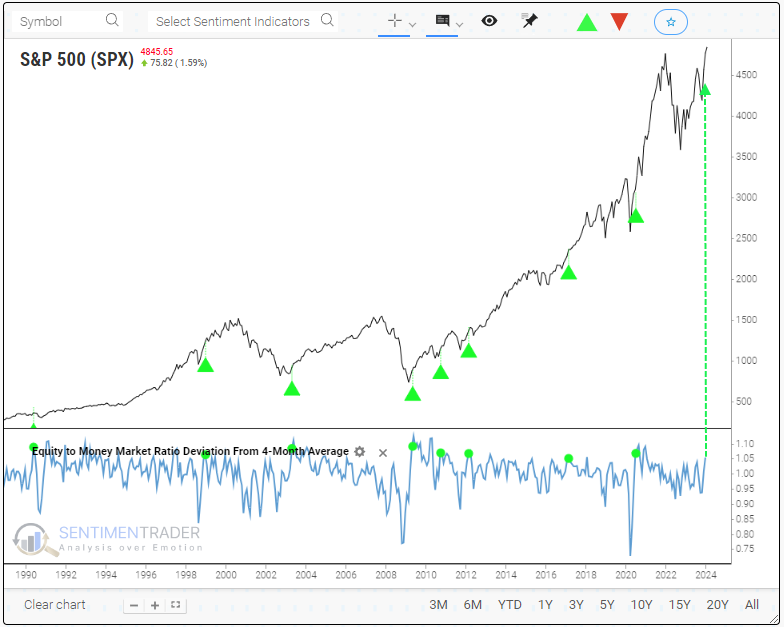
With the most recent update from the ICI, the equity-to-money market ratio deviation from its 4-month average increased to the highest level since December 2020, triggering a buy signal for a model that measures a shift from below 0.95 to above 1.05.
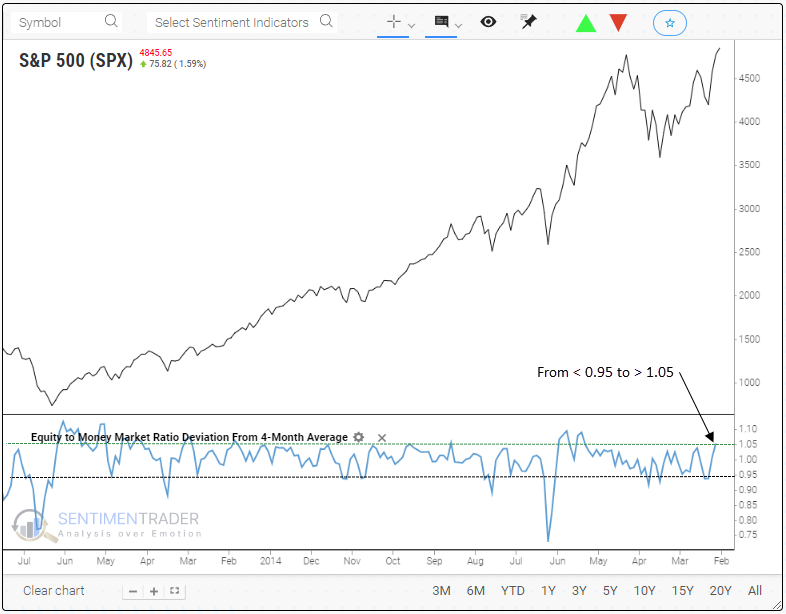
Shifts in the equity-to-money market ratio deviation from its 4-month average, like now, tended to occur after corrections and bear markets. In most cases, the Federal Reserve was lowering interest rates, resulting in a less enticing cash option, which is not the case now.
Similar inflections between equity and money market assets preceded bullish outcomes
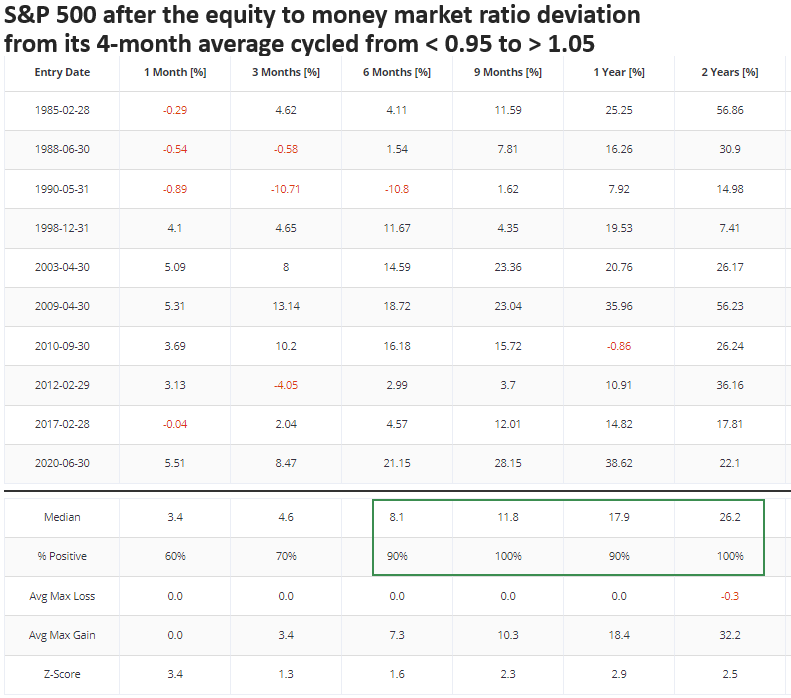
When the equity to money market ratio deviation from its 4-month moving average cycled from less than 0.95 to greater than 1.05, indicating a shift in investor sentiment away from the safety of cash-like securities in favor of stocks, the S&P 500 was higher 100% of the time over the subsequent nine months.
In May 1990, just two months before the onset of a bear market and subsequent recession, investors transitioned from a risk-averse mindset to a risk-seeking attitude, resulting in an untimely decision. Interestingly, short-dated bond yields offered an enticing option with a 2-year yield above 8%.
From a sector perspective, early-cycle cyclical groups tended to outperform the S&P 500 over the subsequent year.
How did I create the equity-to-money market deviation from an average indicator?
The website now boasts the My Indicator solution as one of its latest features. This tool enables subscribers to craft personalized indicators for testing within the newly updated backtest engine. So, I used this tool to create a custom indicator that measures the equity-to-money market ratio relative to its 4-month average.
What the research tells us...
Utilizing real-money sentiment indicators, such as the equity-to-money market ratio, provides valuable insights into investors' mindsets from a big-picture perspective. Generally, as investor's comfort with risk increases, capital shifts from money market funds to equities, leading to a bullish tailwind for stocks. A trading model that monitors inflections in the equity-to-money market ratio triggered a buy signal when the indicator shifted higher relative to its 4-month average. Similar signals yielded excellent results from six to twelve months later.
Although most evidence suggests a positive trajectory for equities over the following year, it's essential to remember the inherent volatility of financial markets. In light of numerous recent warnings, it would be unwise to completely rule out the potential for a countertrend period that tempers some frothy short-term sentiment measures.