
Investors optimistic on economic turn while corporate managers aren't

Key points:
- Over the past year, investors have greatly favored Cyclical stocks over Defensive ones
- Corporate managers have a poor economic outlook, diverging from investors' outlook
- Similar divergences typically preceded gains for stocks, though Cyclicals pulled back relatively
A historic split between investors and managers
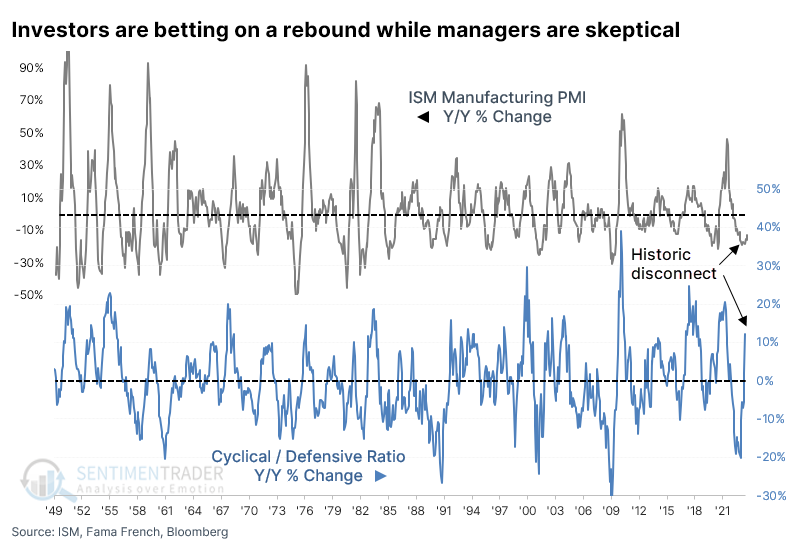
The last year and a half has been populated by a lot of "never seen before" phenomena. To those, we can add a historic disconnect between the sentiment of investors and corporate managers.
Here's a current favorite of this situation being bandied on Twitter, with other versions having a different flavor but the same message. Investors have bid up the price of cyclical stocks versus defensive ones, while managers in the ISM Manufacturing survey have a poor outlook.
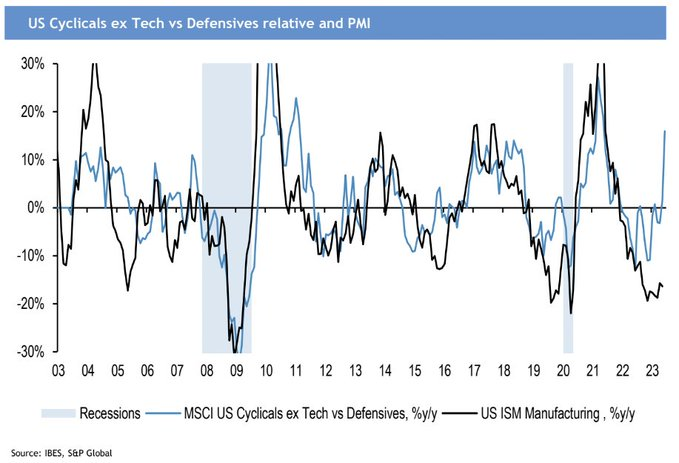
As it always is with macro doom, the implication is that stocks have gotten ahead of themselves because of [insert scary economic scenario here]. This particular one shows that investors have become overly confident in a soft landing in the U.S. because they've bidded up shares of cyclical stocks while ignoring defensive ones, even though the outlook for manufacturing activity is abysmal.
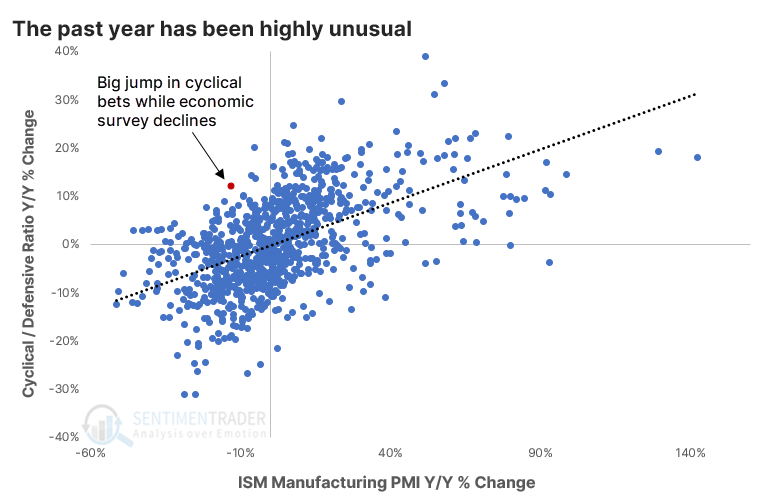
There is no doubt this is an unusual situation - since 1948, it has never happened before. There has never been another month, other than June, when the year-over-year growth of the ratio between Cyclical and Defensive stocks was greater than +10% while the growth in the ISM survey was less than -10%.
Over the past 75 years, there has been a correlation of +0.54 (out of a scale of -1.0 to +1.0) between the year-over-year change in the two data series, so a relatively strong positive relationship.
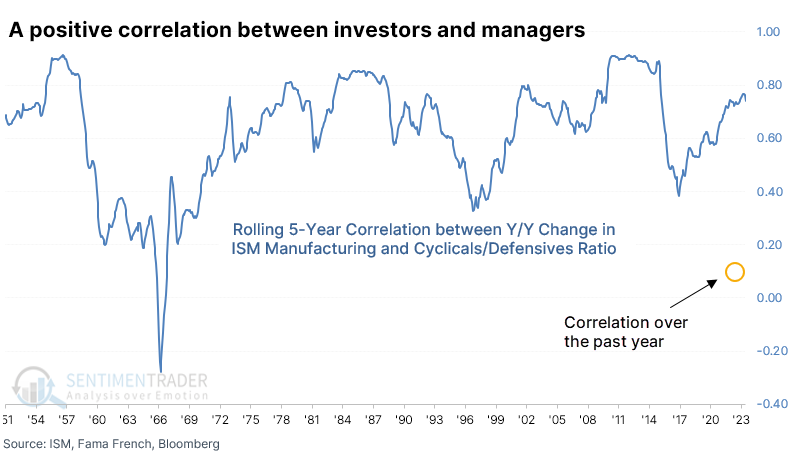
The relationship has gotten even stronger in recent years, making the past year an outlier. The 5-year rolling correlation between the two series is +0.74, but the correlation is barely positive over the past year.
Divergences preceded gains for stocks...Cyclicals, less so
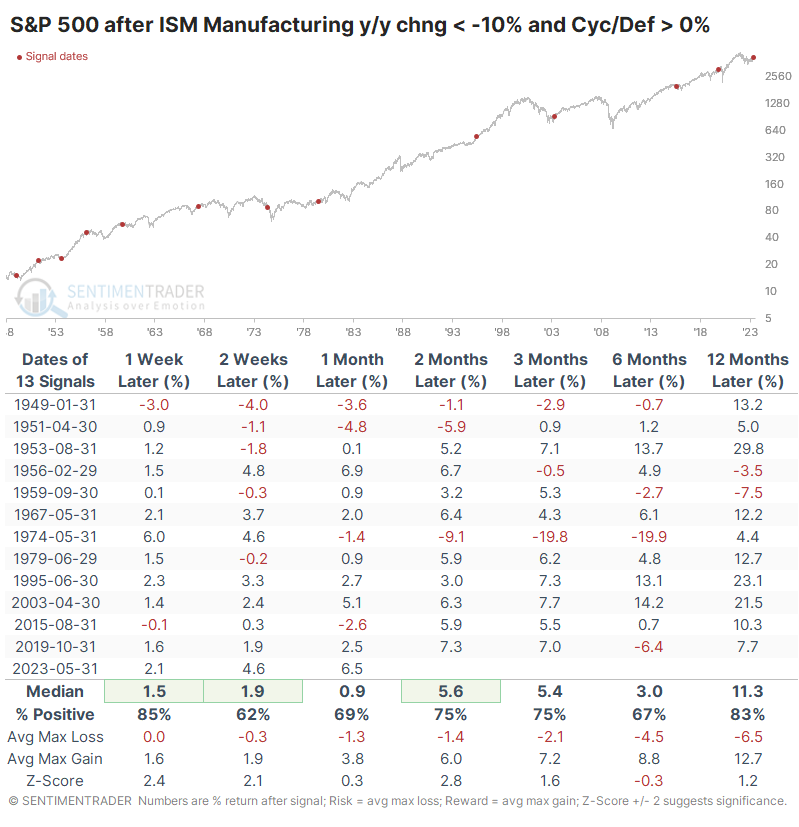
As always, we're more concerned about the implications of this behavior for investors moving forward based on how they've reacted in the past. In that sense, it has mostly been a good thing. This triggered in May, and the S&P 500 had a fabulous June. After the other signals, the S&P kept going, showing a positive one-year return after 11 out of 13.
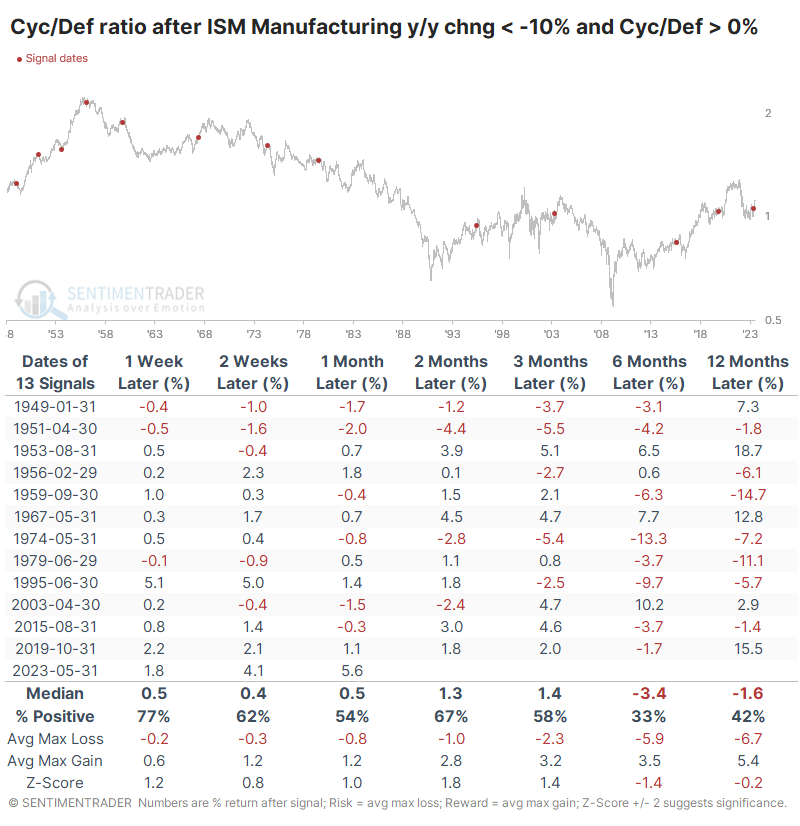
It was less of a consistently good sign for the ratio between the two sectors. While Cyclicals tended to keep outperforming Defensives in the first few months after the signals, only four signals kept it up over the next six months.
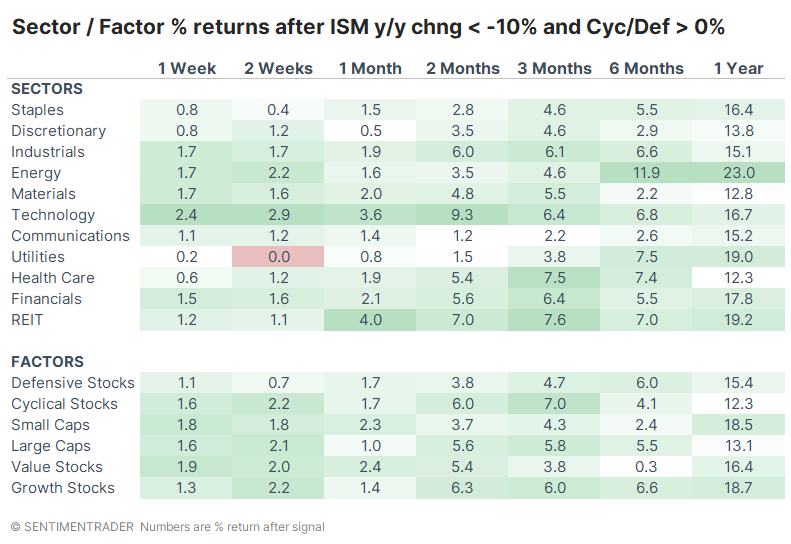
Among sectors and factors, the best performers were an interesting mix. Energy stocks showed the best gains, along with Technology. Health Care and Real Estate also tended to perform quite well. Over the next six months, Growth stocks gained 92% of the time, versus only 50% of the time for Value stocks.
Most extreme signals still (mostly) preceded gains
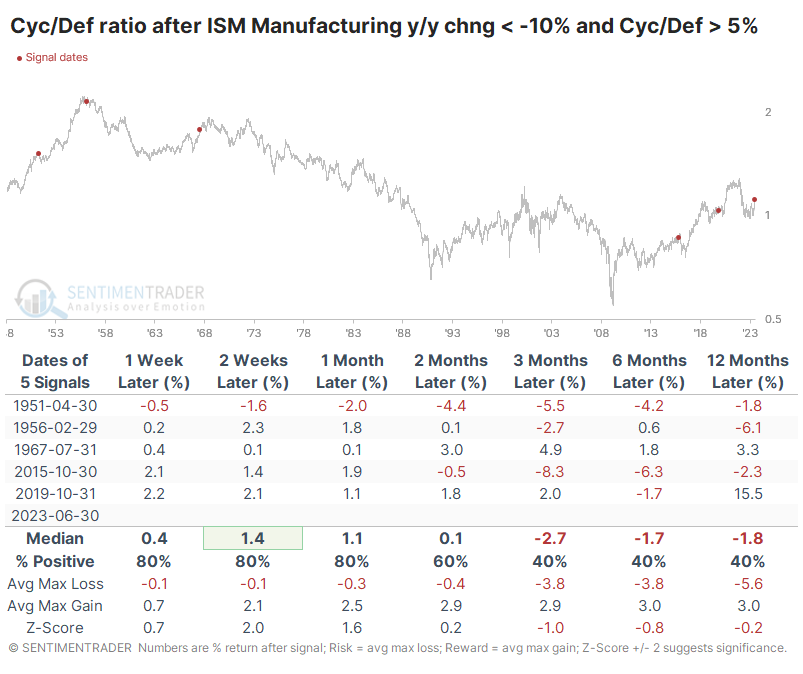
Due to the extreme nature of the current signal, let's look at some of the more egregious precedents. These are the few times when the ISM year-over-year change was still below -10%, but the Cyclicals/Defensive ratio rose by at least +5%.
It's inherently difficult to read much into such a tiny sample size, and that becomes doubly so when the signals precede inconsistent returns. For what it's worth, the S&P 500 was lower most of the time six months later but higher every time but once twelve months later.
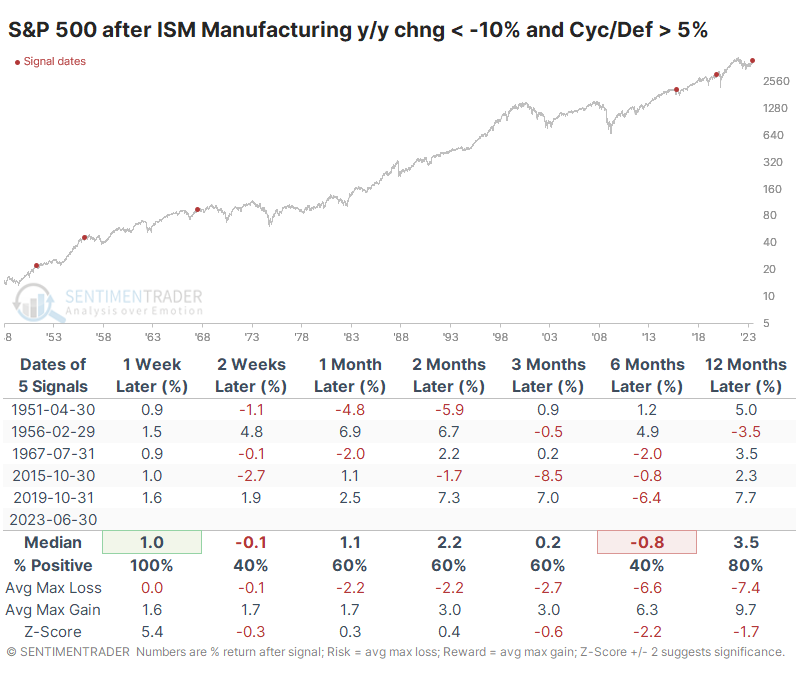
These extreme signals tended to lead to further relative gains for Cyclicals in the shorter term but not, the longer term.
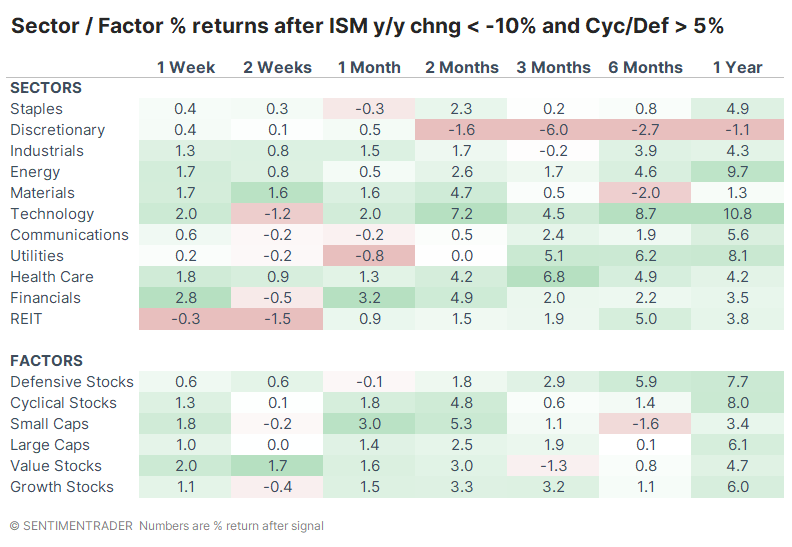
Discretionary stocks bore the brunt of ugly returns following these extreme signals, with only one positive return over the next six months and a -2.7% average return. Technology stocks rose almost every time.
What the research tells us...
We've noted many times over the past eight months that after a year like 2022, investors will latch onto any data point suggesting a resumption of the decline. We've been publishing these studies through some of the worst bear markets of the past 20+ years, and that behavior is one of the defining characteristics that has not changed. When a chart like the first one gets bandied about on social media, the immediate and widespread hot take is that it means doom. Maybe it will; I dunno. I only know that when similar circumstances arrived over the past seven and a half decades, stocks still managed to gain most of the time, with no significant and lasting declines. It was less of a comforting situation for investors currently piling into Cyclical stocks while ignoring Defensive ones.