
Investors ignore Berkshire, buy everything else

Key points:
- Nearly 80% of NYSE issues advanced on back-to-back days, a rare feat with stocks at their highs
- One big exception is Berkshire Hathaway, which has plunged relative to the S&P 500
- While both could be considered signs of excess, there is little evidence for it, as future returns were exemplary
Big back-to-back buying breadth
After a rocky start to last week, buyers came back in a big way, and across the market.
When small-cap stocks surge, it almost always translates into good breadth figures on the NYSE, and last week was no exception. The Russell 2000 had a couple of very good days, driven by a broad rally among smaller stocks. That directly translated into back-to-back days with more than 75% of advancing issues on the NYSE. There haven't been too many of those days this year, especially on consecutive sessions.
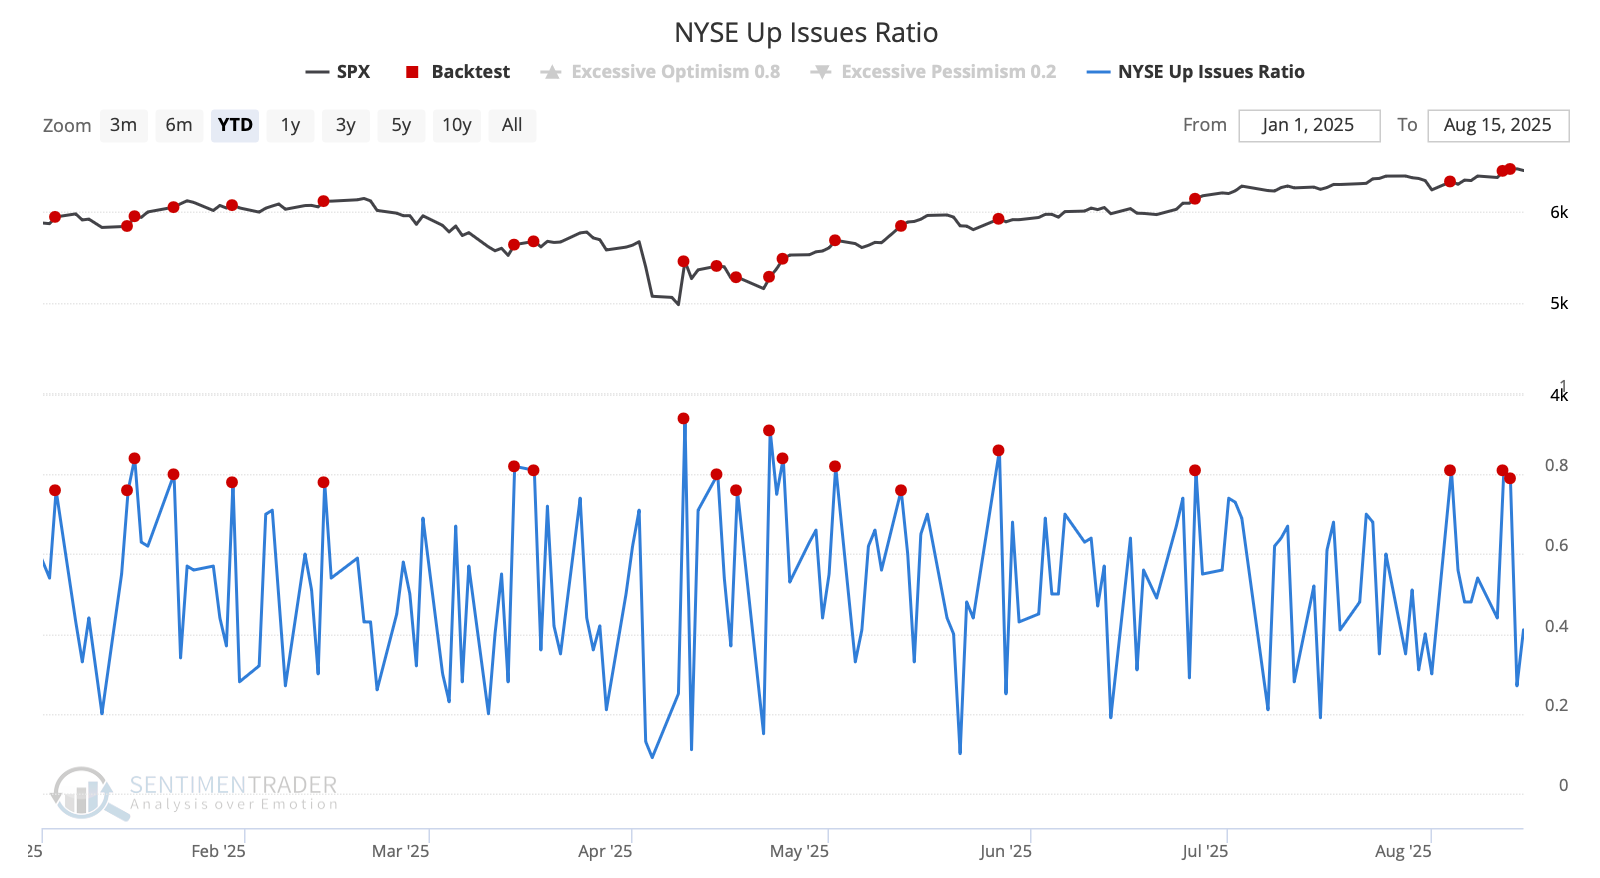
As we saw in April, clustered sessions with strong NYSE breadth are not unusual after a significant decline. However, it's much more remarkable to see this when the S&P 500 is trading at a multi-year high, and it's been even more bullish for future returns.
The table below shows the few times when the S&P was at a multi-year high at the same time there were consecutive sessions with at least 75% of issues advancing on the NYSE. There were only a handful of precedents, and they were all bullish.
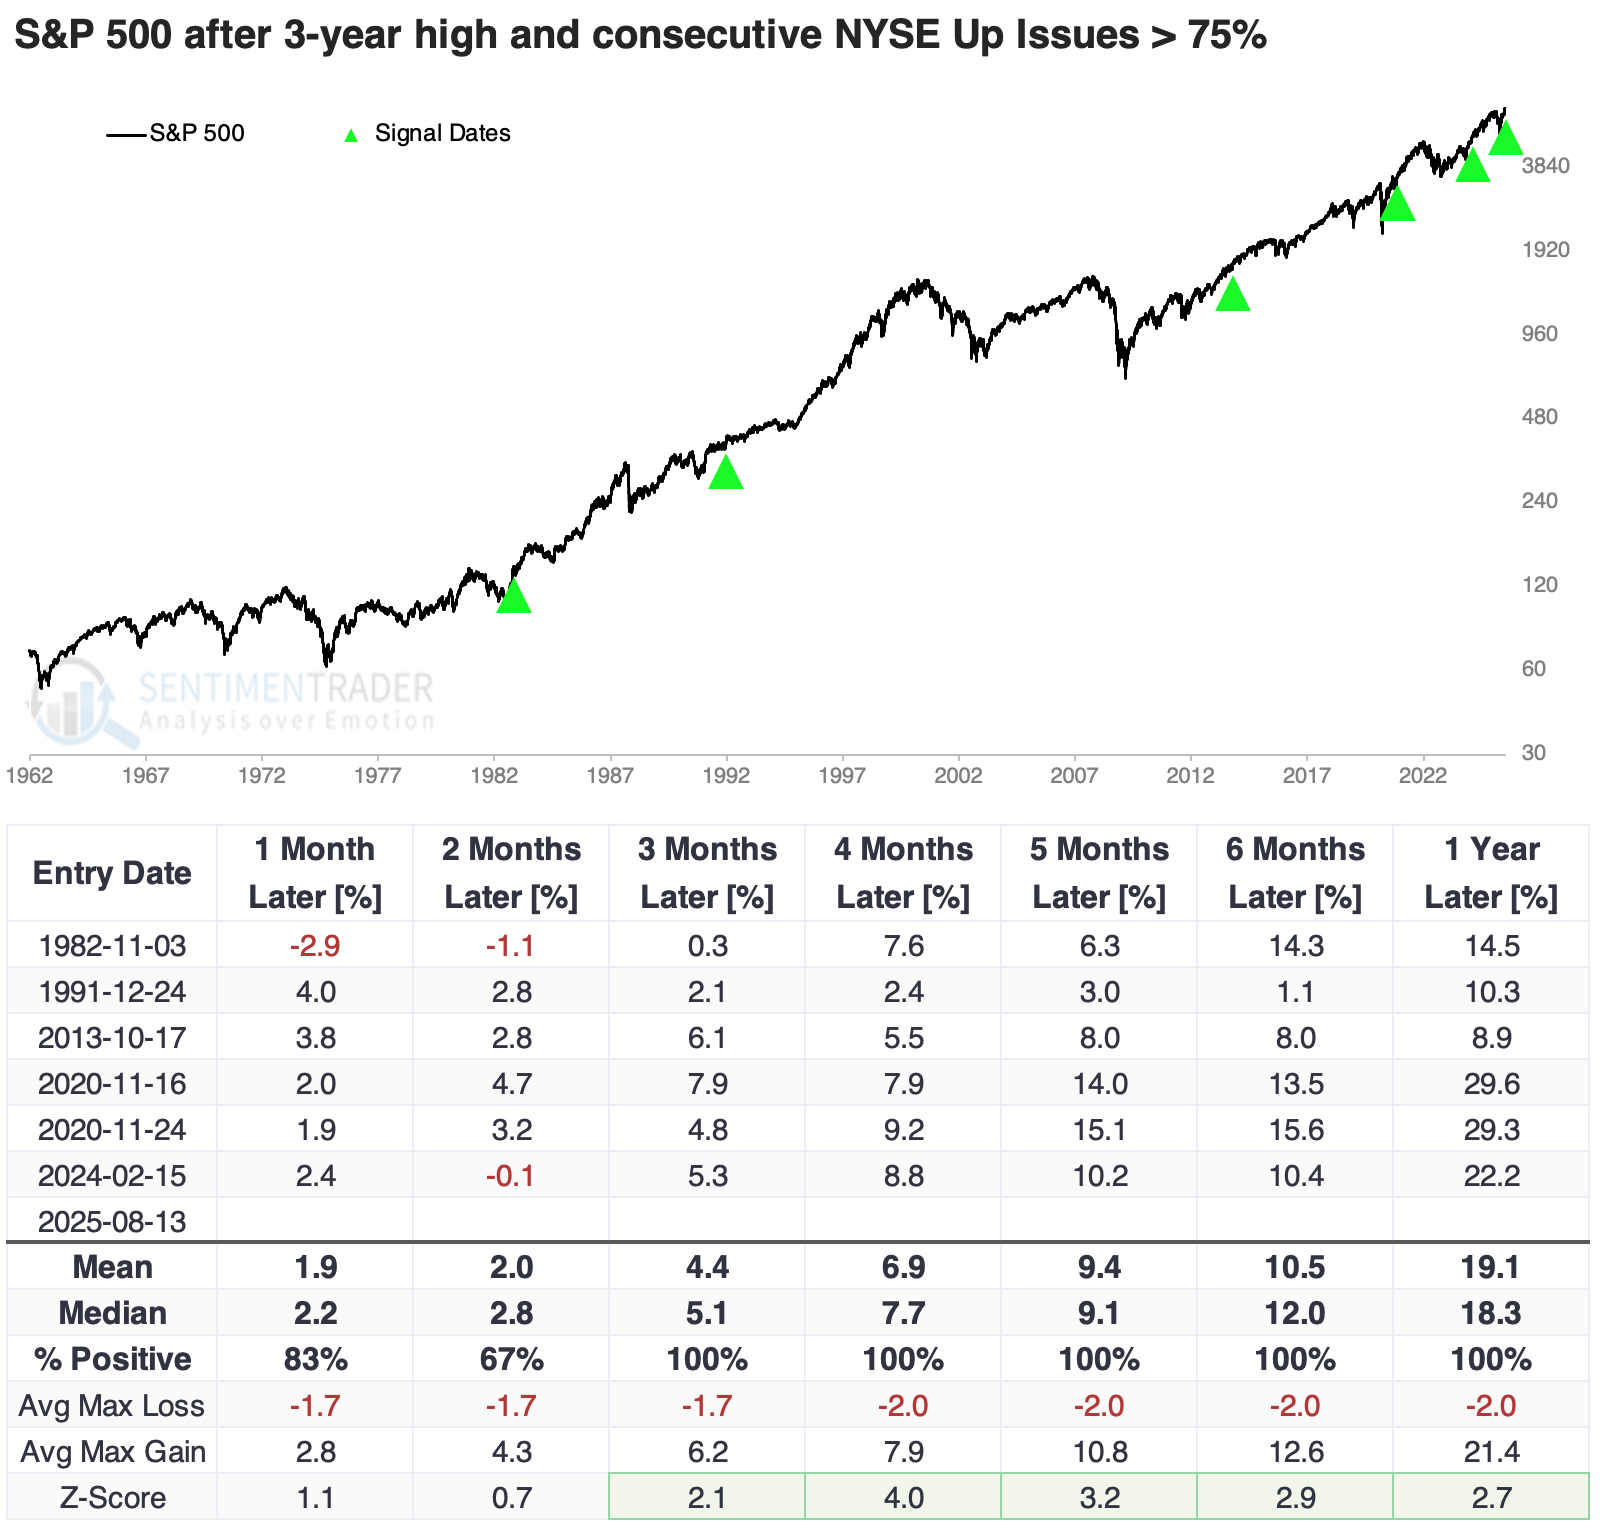
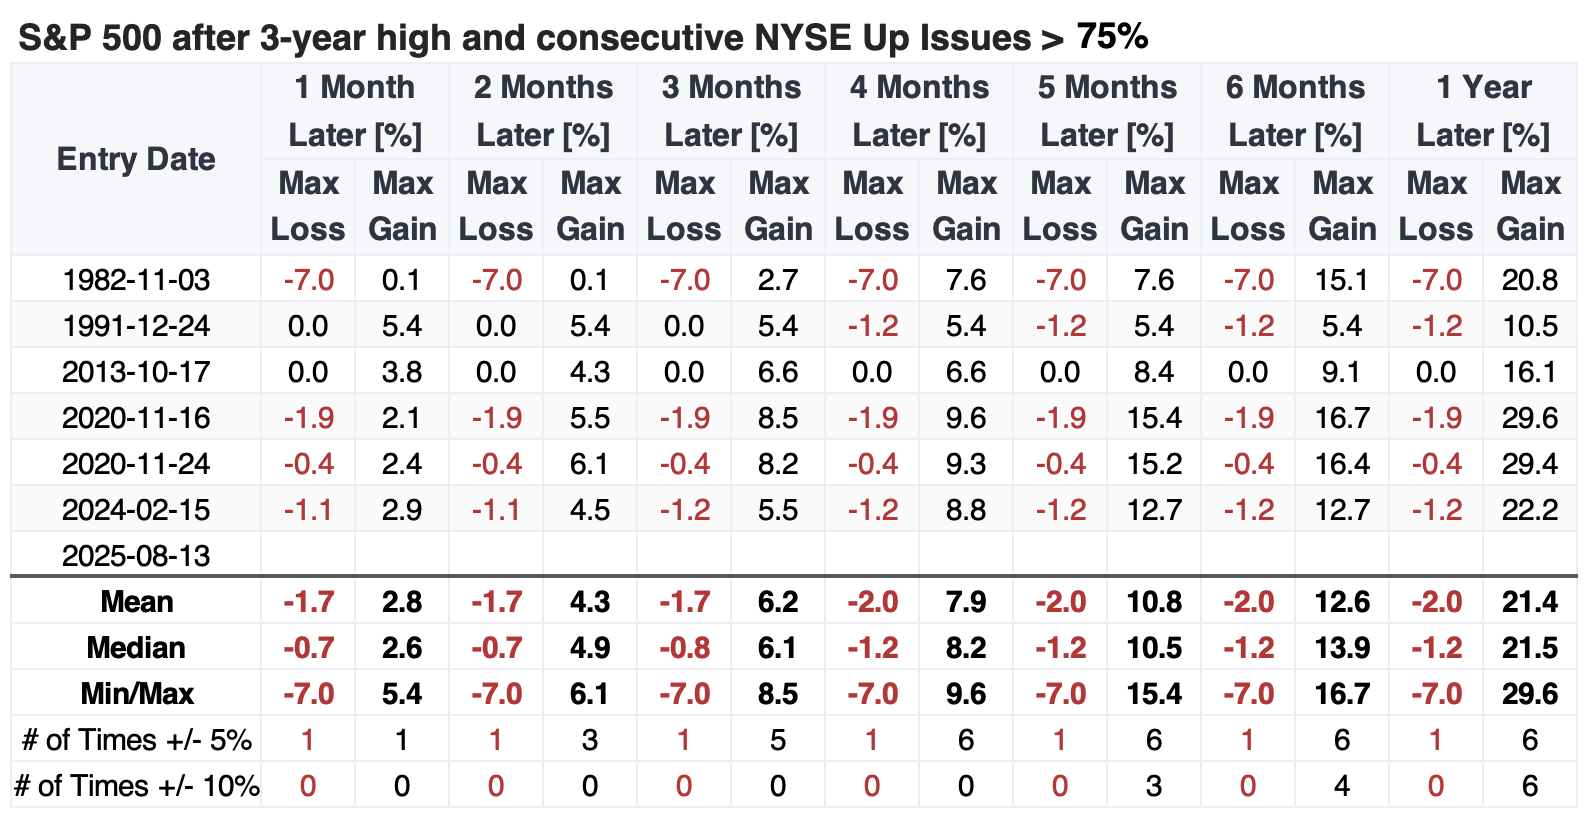
The table of maximum gains and losses across time frames shows just how impressive the signals were. Even up to a year later, the maximum decline at any point across all the signals was only 7%. The others were all smaller than 2%. The S&P gained at least 10% every time.
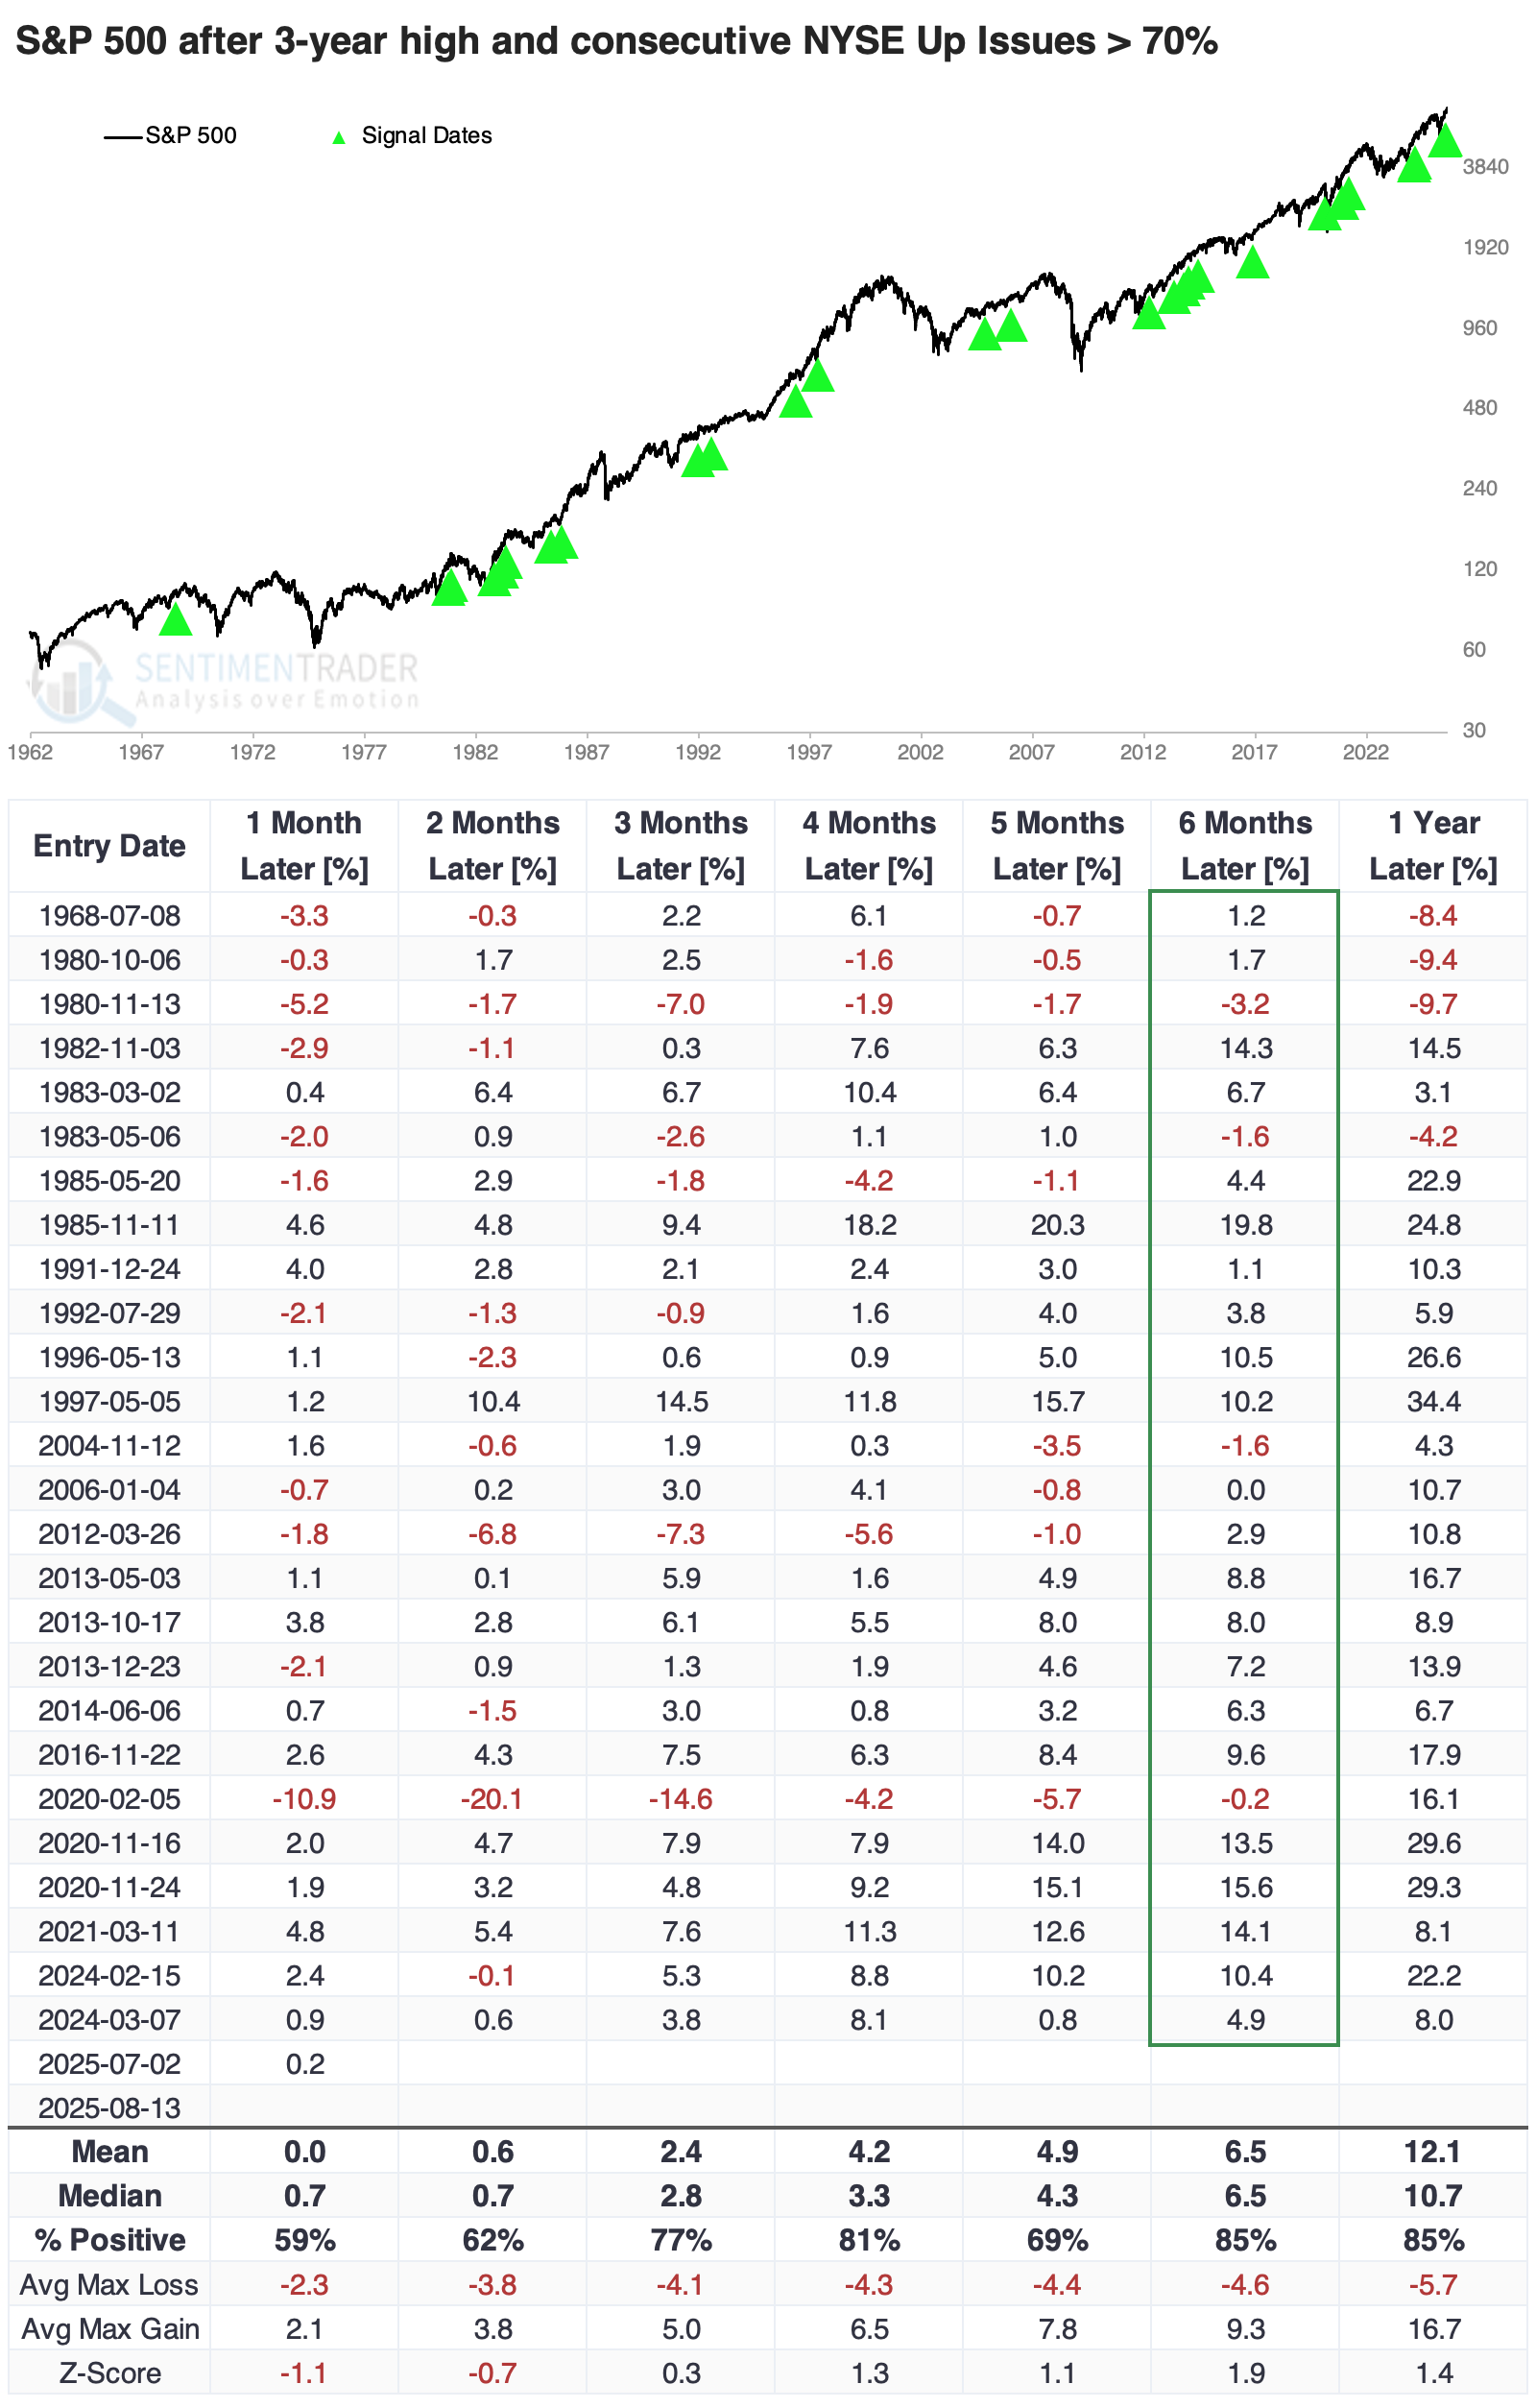
We can generate a large sample size by relaxing the threshold to 70% Up Issues. When we do that, the following six months were excellent for the S&P, with only four small losses. The signal that occurred right before the pandemic panic preceded a sickening drawdown, but that was the only instance that witnessed more than a 10% decline at any point up to six months later, with the median drawdown being less than 4%.
A big exception
One stock that has definitely not been among the advancing stocks is Berkshire Hathaway.
While we shy away from trying to assign reasons for stock or market movements, sometimes they're pretty evident. The combination of a retiring legend in Warren Buffett and a company with a record cash balance during a runaway momentum bull market is deadly for returns. For one of the few times in more than 45 years, the ratio of that stock to the S&P 500 has plunged more than 20% over the past 90 sessions.
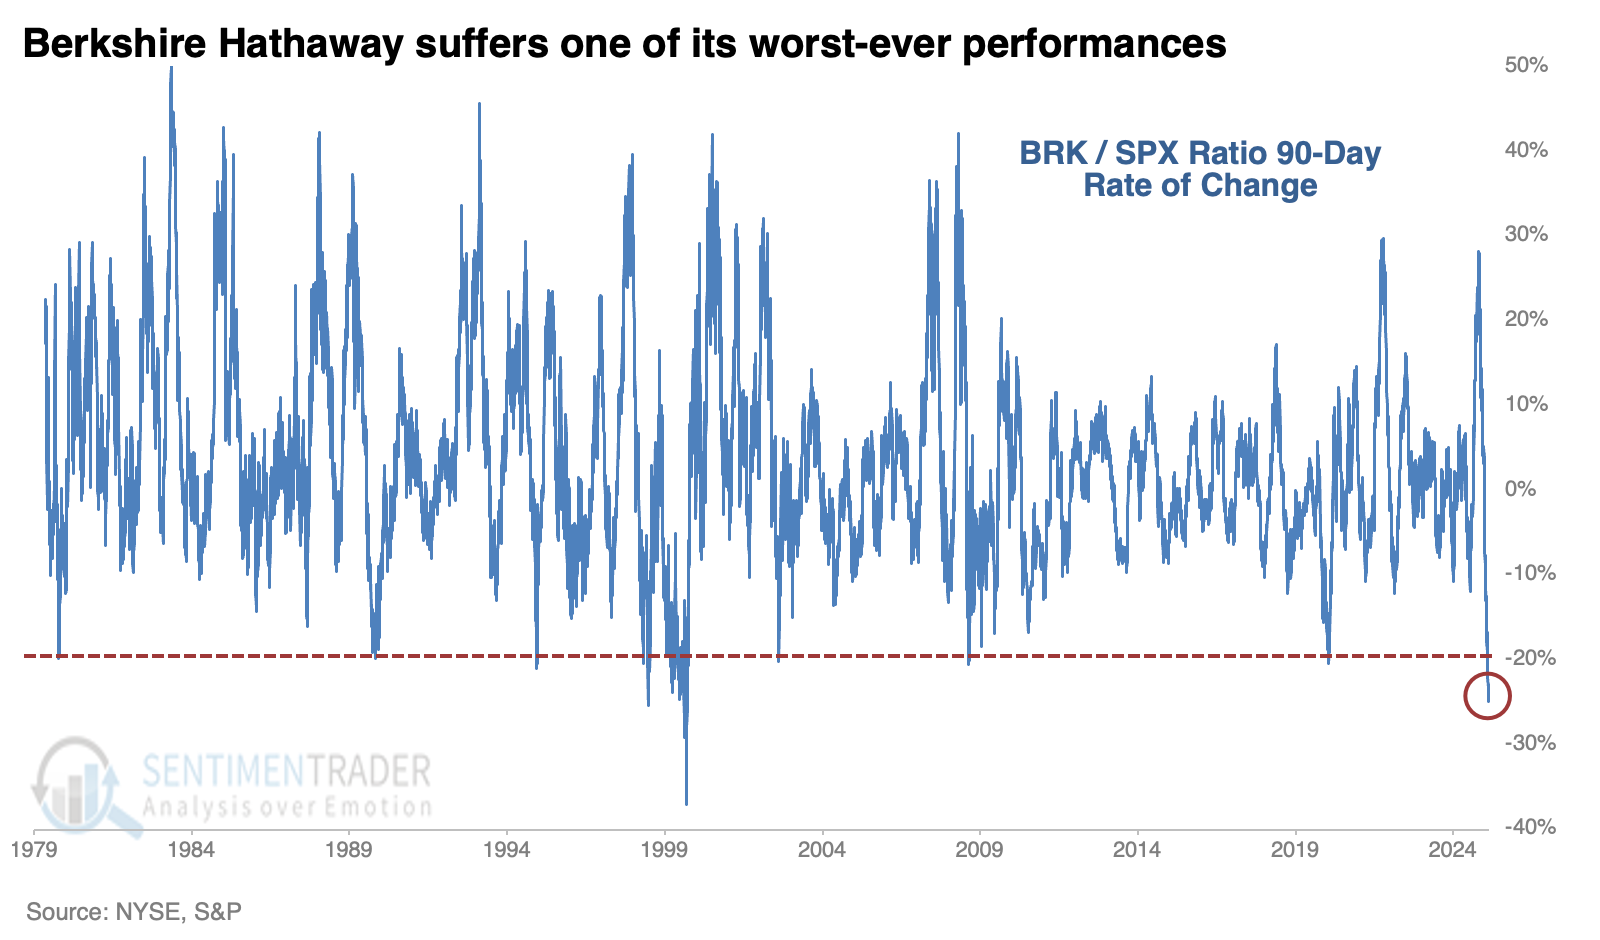
Something similar happened in 1999, when the market discounted Buffett's savvy as it engaged in the animal spirits of "this time is different," and companies scrambled to add .com to their names.
It's natural to worry that this is a repeat of those times. Given the sentiment surrounding the AI stocks, there are certainly some reasons to suspect so. But even after Berkshire's extreme underperformance in 1999, the S&P continued to rally for months on end. That was the case after each of the other instances, as well.
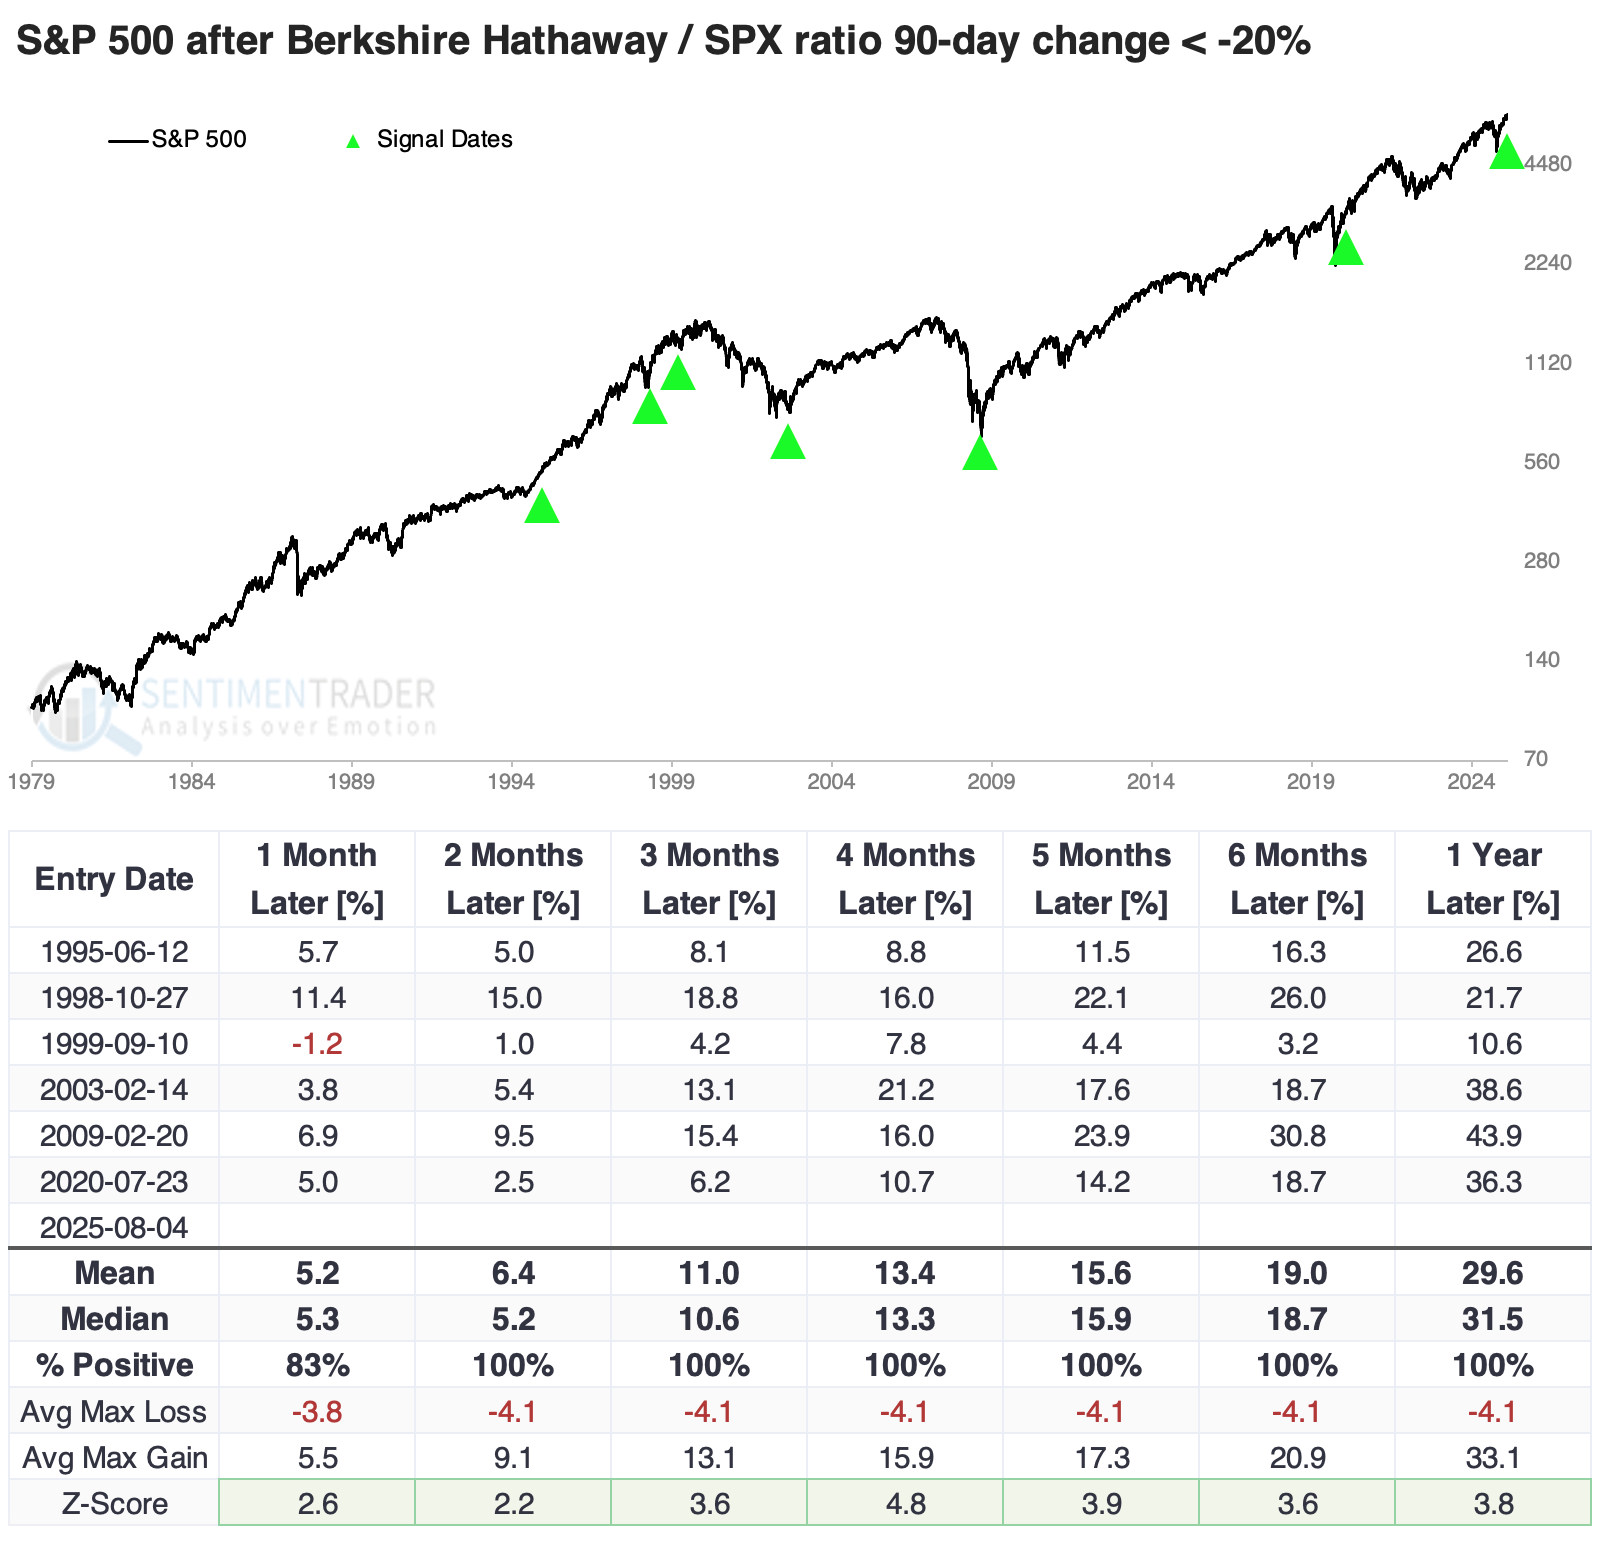
Similar to the breadth scenario above, the drawdown in the S&P after these signals was minimal. Due to the volatility of the 2009 global financial crisis, that was the only one to suffer more than a 10% drawdown, which occurred almost immediately. The median drawdown across all instances was only 2.4% over the following year.
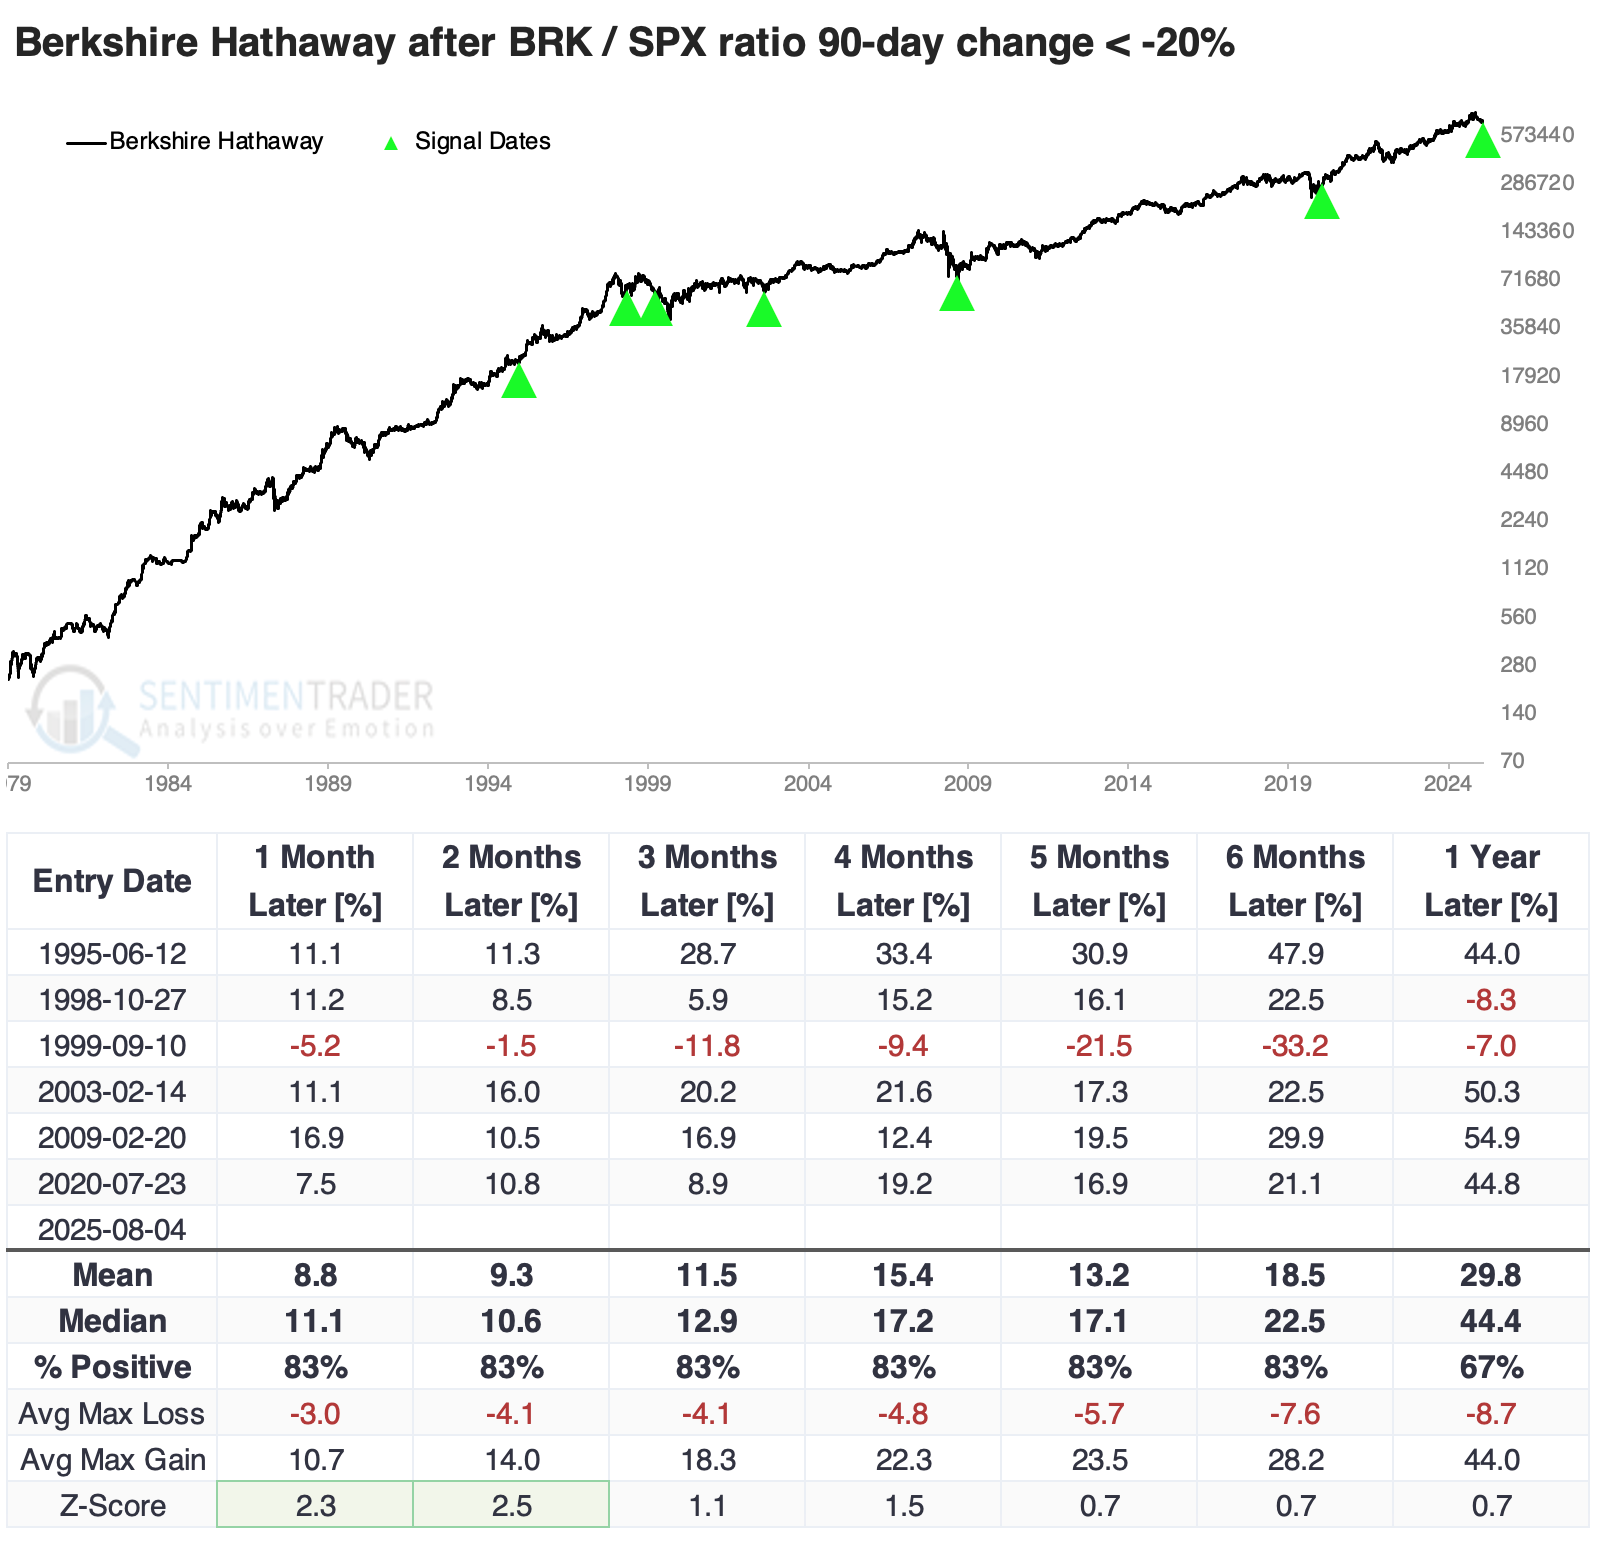
The strength of the investors at the helm of Berkshire would make it easy to assume that Berkshire quickly snapped back after these bouts of extreme underperformance. That was mostly the case, though ironically, the 1999 signal is the one where it failed, as investors avoided anything safe or defensive at the time. Berkshire rallied at least 20% in the six months following the other signals.
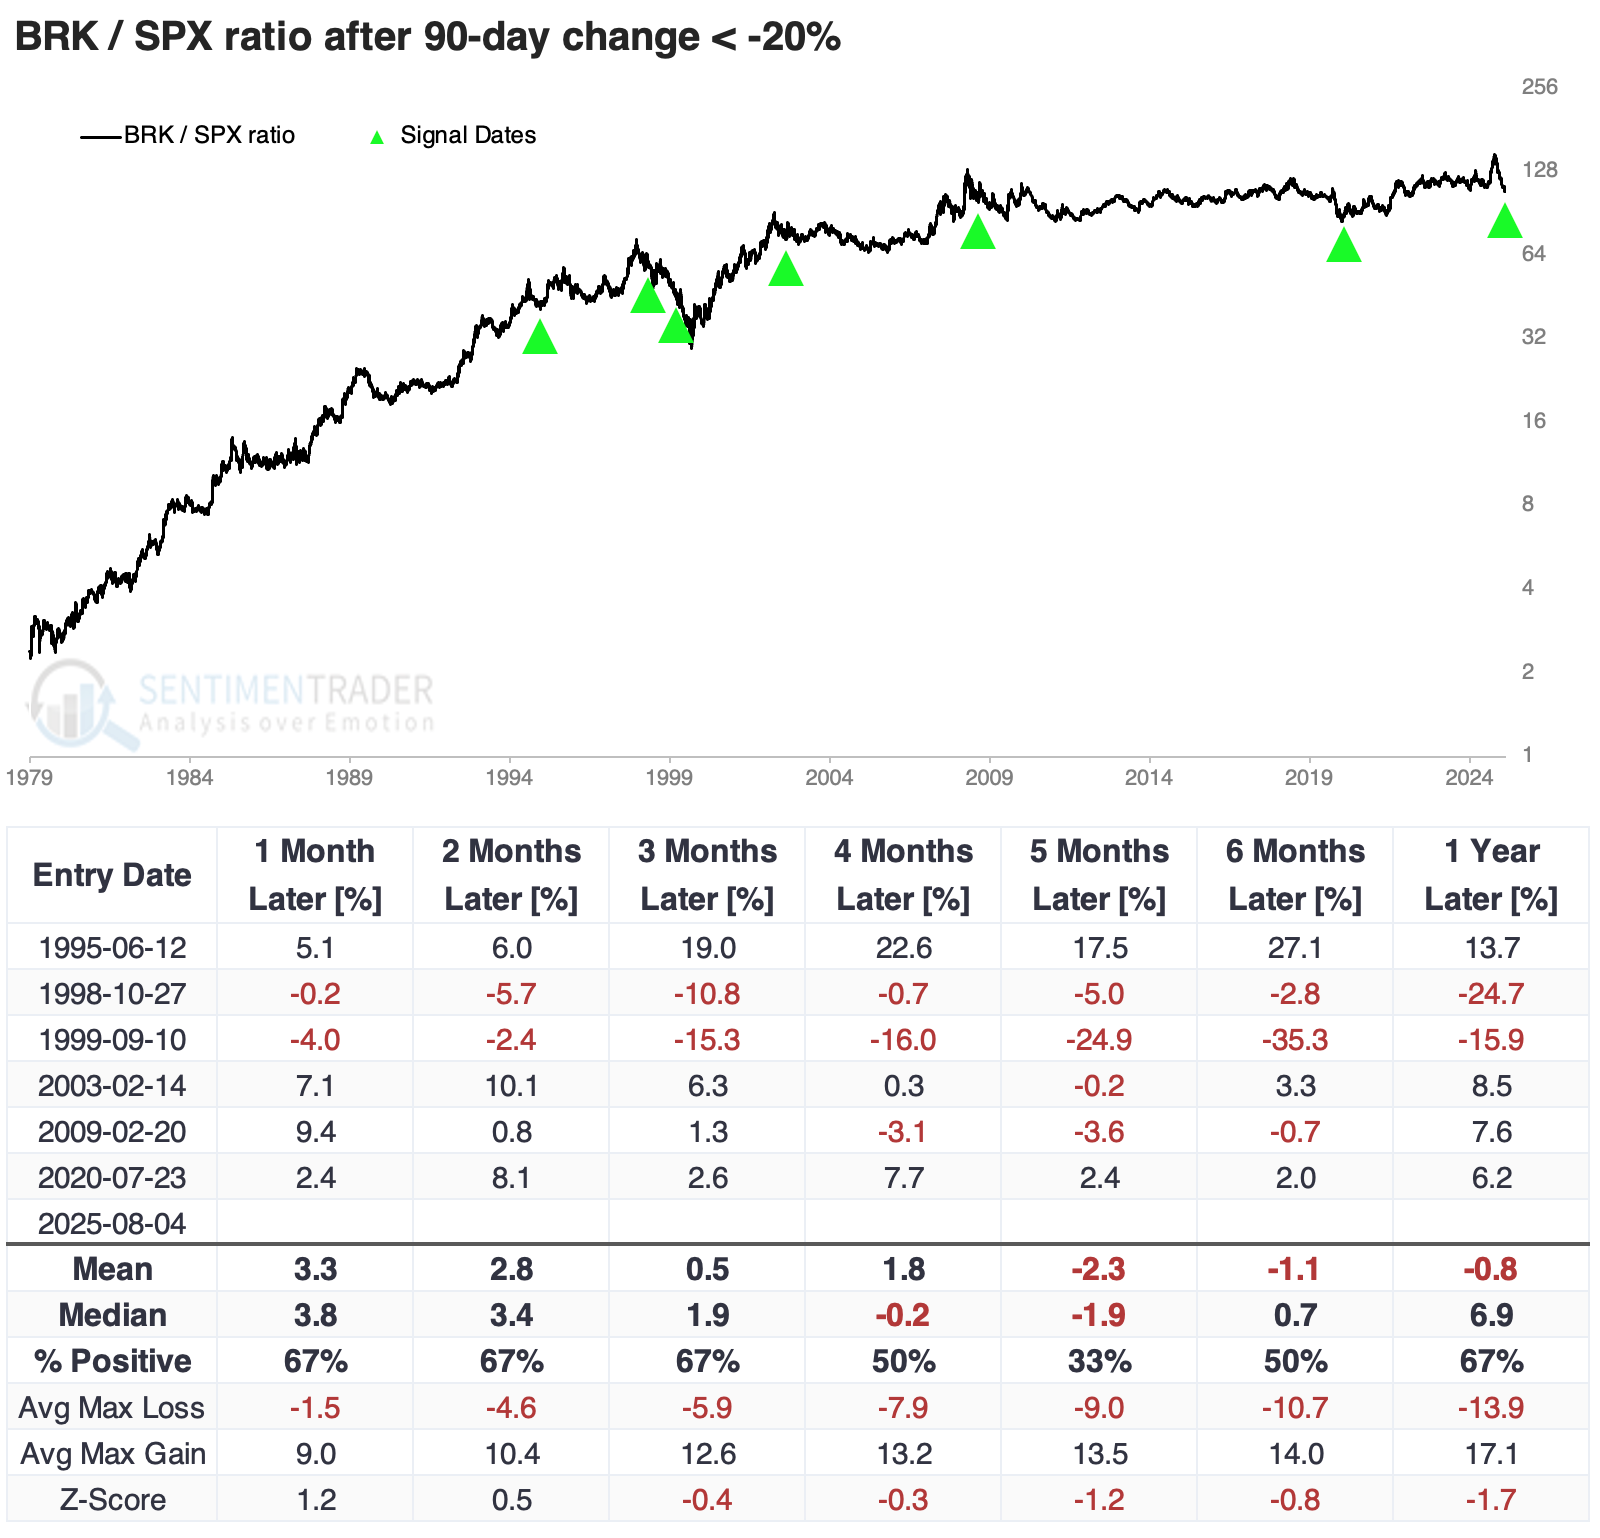
Surprisingly, these were not great times to bet on mean reversion. After four of the six signals, Berkshire continued underperforming the S&P 500 over the following five months. One of the others preceded a modest outperformance, while the other was an excellent time to bet on a rebound for Warren and Charlie.
What the research tells us...
There have been some modest short-term concerns about market breadth, specifically among big tech stocks. That's still in force, but investors rotated to other shares in a big way. A couple of days last week saw broad and robust buying interest of a magnitude rarely seen when indices are at multi-year highs. It's been an excellent sign when it happens.
With the fervor over AI and its resemblance to the late 1990s internet bubble, another concern has been that suddenly left-for-dead stocks like Berkshire are a sure sign of irrational greed. But there are some legitimate reasons why this time might be different, and anyway, previous instances were not a sign of an imminent peak.