
Investors have rarely favored stocks so much over bonds

Key points:
- The spread between sentiment toward stocks and bonds is nearing a record high
- After other extreme readings, stocks tended to struggle shorter-term while bonds tended to rally
- Over a long time period, stock sentiment has rarely been this optimistic and bonds this pessimistic
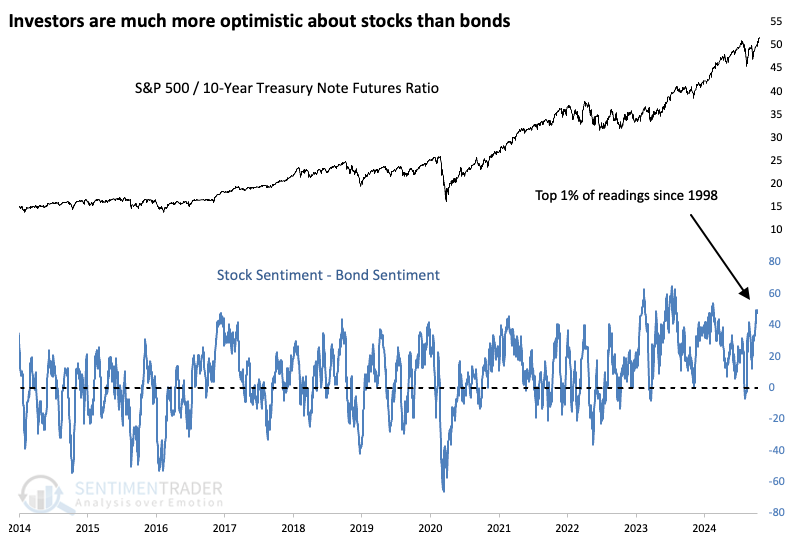
A near-record disparity between stock and bond sentiment
It almost doesn't matter what measure we look at. There are some isolated exceptions, but most indications suggest that investors are optimistic about the prospects for stocks in the months ahead. It's a different story in the bond market. After a brief bout of not-pessimism a couple of months ago, bond investors are back to feeling gloomy.
That difference of opinion on the relative merits of the two markets has caused the spread between stock and bond sentiment to spike close to a multi-decade high. Over the past 25 years, there haven't been many times when the Intermediate-term Optimism Index for stocks was more than 50% higher than the Bond Optimism Index.
Good for bonds
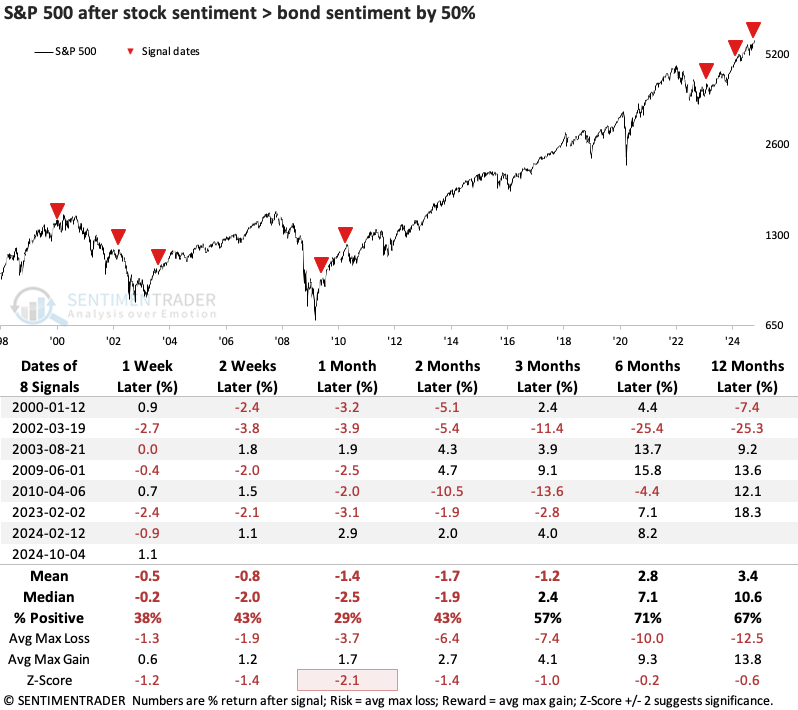
As for whether such a wide disparity in sentiment makes any difference, the table below shows S&P 500 returns after the spread between the two optimism indices reached 50%. And for the S&P, it was a short-term headwind. Its returns were particularly poor over the following month, with only two winners and five losers. However, only the signal during the post-dotcom bubble resulted in a sustained decline.
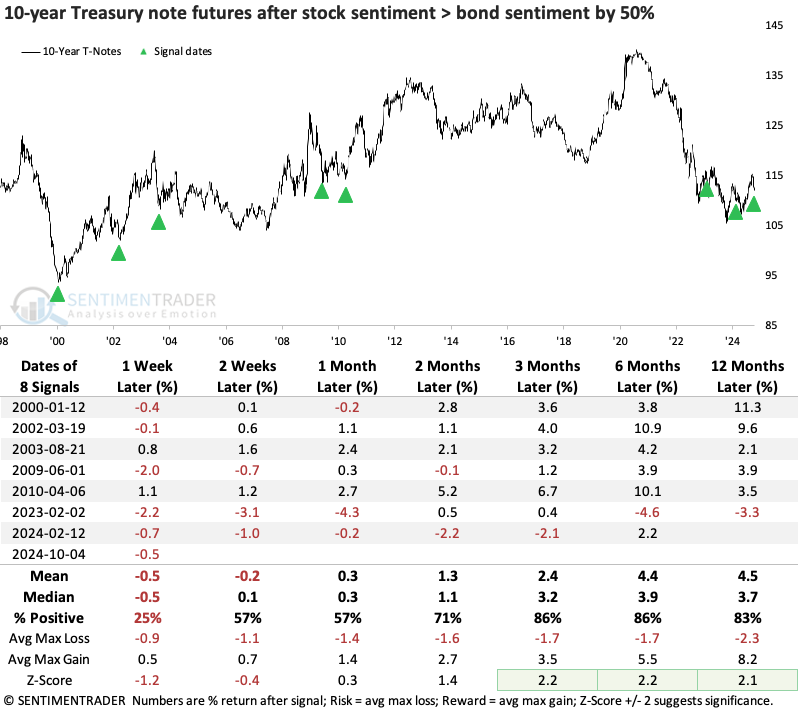
The disparity was a much better sign for bonds. Three to six months later, 10-year Treasury note futures showed a strong tendency to rally, with returns well above any random time during the study period. The signal in early 2023 was not very favorable for bulls, with only a brief period of positive returns 2-3 months later.
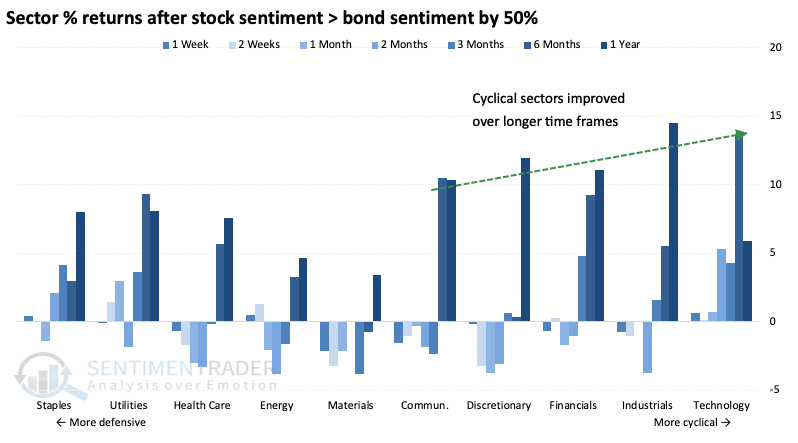
Most sectors showed relatively poor returns in the shorter term after these signals. Oddly, the most defensive sector (staples) held up well, as did the most cyclical one (technology). Over long time frames, returns increased the more cyclical the sector.
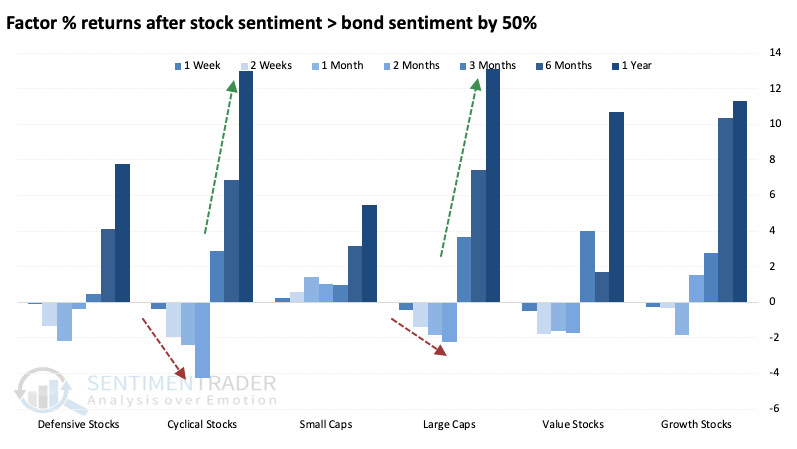
We can see that pattern more clearly when looking at factor returns. Cyclical stocks showed increasingly poor average returns up to two months later, then increasingly positive ones. Large cap stocks showed the same pattern. Also somewhat oddly, small cap stocks held up okay across all time frames, even when other stocks struggled over the next couple of months, though they showed the lowest average longer-term returns.
Zooming out
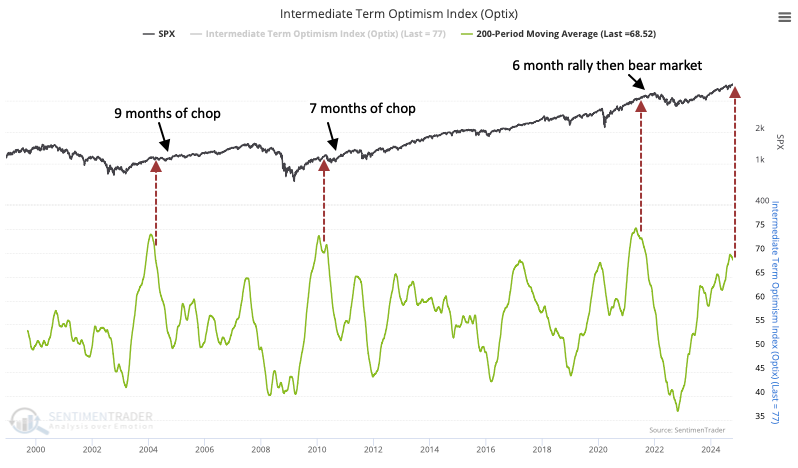
One additional wrinkle that may influence stock vs. bond returns is just how long these extremes have persisted. The 200-day average of the Intermediate-term Optix for stocks just curled lower after nearing 70%.
It reached this level and turned lower three other times, all leading to at least months of chop. It nearly reached this level in 2017, which preceded months of a melt-up market that were ultimately given back - a hard market for just about everyone.
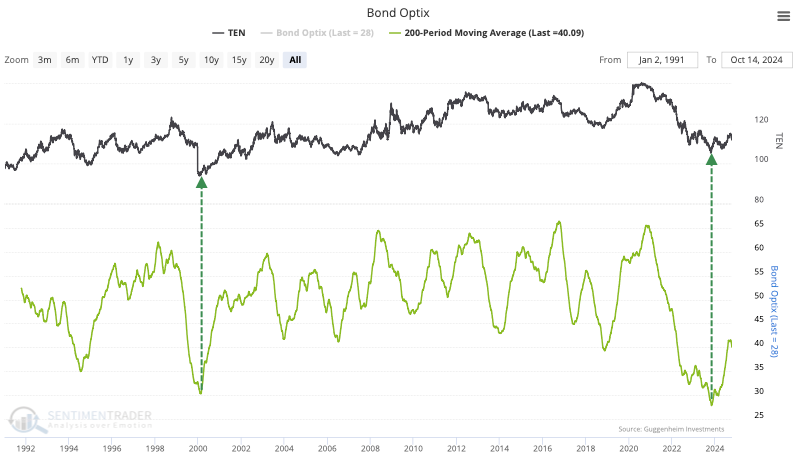
For the bond market, the 200-day average of the Bond Optix troughed near the end of 2023 and has been climbing, but from a record low level. The only comparable period was the year 2000, which preceded sustained gains in 10-year Treasuries.
What the research tells us...
Sentiment and momentum are often in direct opposition. Just when things are looking best for trend-following momentum chasers, it looks the most at-risk for contrarian-minded investors. We're reaching one of those times now, as momentum is impressive and compelling. There is little to no evidence that the gas has run out, as breadth remains robust and sector performance is supremely healthy.
Extremes in sentiment tend to work better when there is less buying interest underlying the indexes. If we saw more divergences with breadth metrics, the extreme disparity in stock-bond sentiment would have more meaning. As it stands, it's probably most useful as an early heads-up that conditions are ripe for disappointment, and we should be on guard for any signs of a buying strike in the weeks ahead.