Products
SentimenTrader Trading Tools
‍
Backtest Engine
My Trading Toolkit
Correlation Analysis
Seasonality
Market Prediction
Indicators & Data API
‍
Proprietary Indicators & Charts
Market Data API
Strategies & Scanner
‍
50+ Trading Strategies
Smart Stock Scanner
Smart Option Scanner
Research Reports
‍
Research Solutions
Reports Library
Free Resources
Simple Backtest Calculator
Simple Seasonality Calculator
The Kelly Criterion Calculator
Sentiment Geo Map
Public Research Reports
Education
Sentiment Indicators
Technical Indicators
Pricing
Company
About
In the News
Testimonials
Client Success Stories
Contact
Log inLoginSign up
< BACK TO ALL REPORTS

Investors have been clamoring for the strongest stocks

Jason Goepfert
2020-06-02
Stocks with the strongest balance sheets have greatly outperformed those with weak balance sheets over the past couple of months. They've outperformed the broader market, too. An index of these strong stocks just hit a new all-time high.

Investors have been piling into stocks, at least judging by the major indexes hitting continual new highs for this recovery.

Not all stocks are created equal, and investors have seemingly been focused on those stocks most likely to survive the shakeout currently in progress. An index of stocks with strong balance sheets just hit a new high, fully recovering from the pandemic decline. Those with weak balance sheets are still struggling.

Per Goldman Sachs:

"Our Strong Balance Sheet basket identifies 50 S&P 500 companies across eight sectors with strong balance sheets. We use the Altman Z-score to measure balance sheet strength. The Z-score is a weighted sum of five financial ratios and was originally developed to forecast bankruptcies.

Our Weak Balance Sheet basket identifies 50 S&P 500 companies across eight sectors with weak balance sheets ... As the credit environment tightens, these firms will be less likely to have access to funds needed to invest in growth."

We can see the huge disparity between them below.

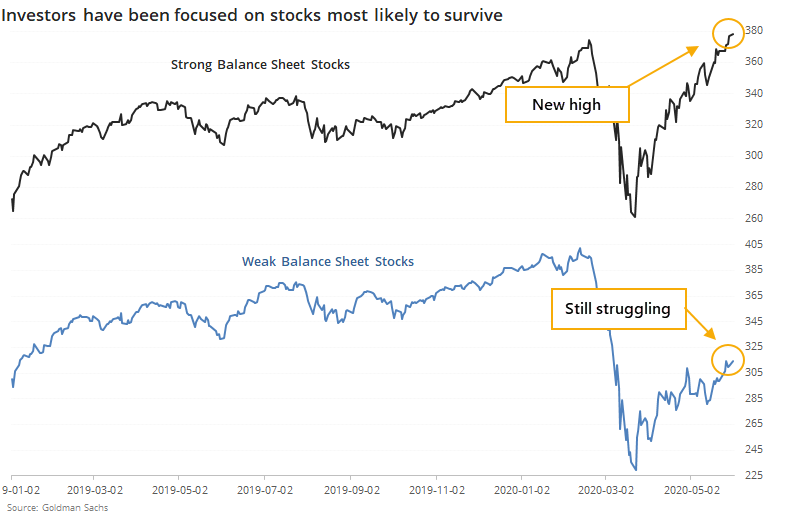
The data for these only go back to 2006, so history is limited. In those 14 years, there has never been a time when strong balance sheet stocks reached a 52-week high while weak ones were more than 10% below their own high. There was never a time when they hit a high and the S&P 500 was more than 5% below its high, either.

If we look for times when there was a smaller divergence, when both the S&P and weak balance sheet stocks were more than 1% off their highs while strong balance sheet stocks broke out to the upside, it hasn't necessarily been a great sign.

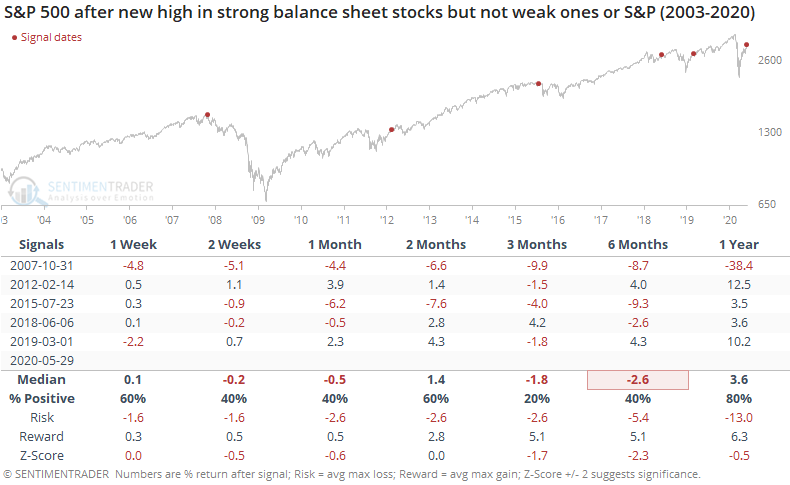
The S&P showed a negative return at some point over the next 1-3 months every time. Again, the sample size is tiny and history is limited, so we can't put too much weight on this, but it looks to be a modest short- to medium-term negative.

On a relative basis, strong balance sheet stocks had a mixed record relative to weak balance sheet stocks, but over the next 6 months, they underperformed (suggesting that investors shifted toward stocks with weaker balance sheets as stocks).

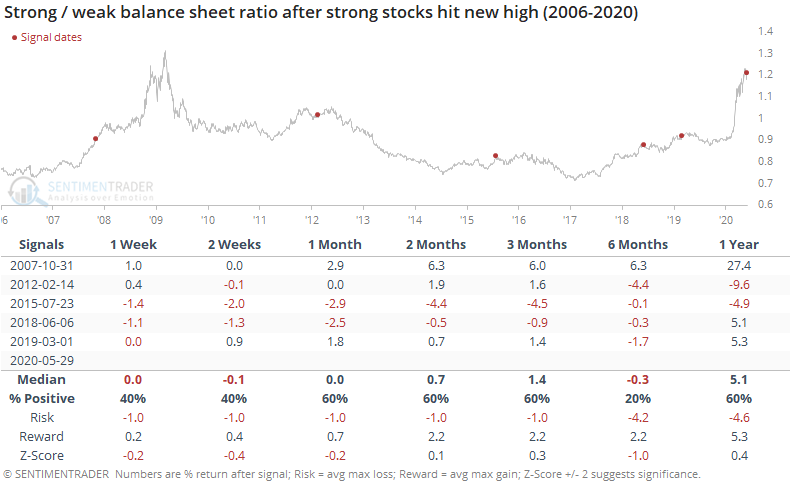
After leading as they have, strong balance sheet stocks had a mixed-to-poor record at continuing to outperform the broader market.

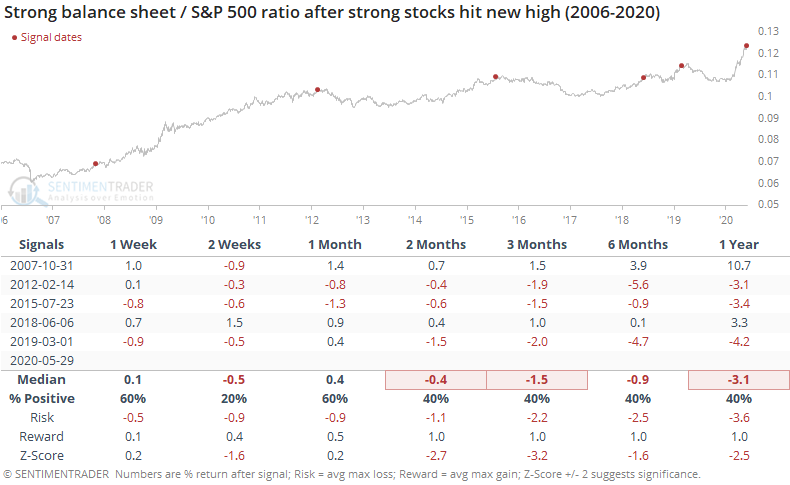
Across most time frames, strong balance sheet stocks showed only a slight outperformance at best against the S&P 500.

Overall, we're limited by a small sample and limited history, but the recent preference for stocks with strong balance sheets looks to be a minor negative for the broader market over the medium-term, but that's about it. By the time it has reached this stage, the strong balance sheet stocks have become stretched relative to their opposites, and the broader market, and had a tendency to underperform.

PRODUCTS
SentimenTrader
Trading Tools
Indicators & Data API
‍
Strategies & Scanner
‍
Research Reports
FREE
RESOUrCES
Simple Backtest
Calculator
Simple Seasonality
Calculator
The Kelly Criterion
Calculator
Sentiment Geo Map
‍
Public Research Reports
‍
Education
Sentiment Indicators
‍
Technical Indicators
‍
Pricing
Bundle pricing
‍
FAQ
‍
Announcements
‍
COMPANY
‍
About
‍
In the News
‍
Testimonials
‍
Client Success Stories
CONTACT
‍
General Inquiries
‍
Media Inquiries
‍
Financial Professionals Inquiries
‍
© 2026 Sundial Capital Research Inc. All rights reserved.
Setsail Marketing
TermsPrivacyAffiliate Program
Risk Disclosure: The information and tools provided are for research and analytical purposes only and are not intended as investment advice. Market analysis involves uncertainty, and outcomes may differ from expectations. Users should conduct their own due diligence and consider their individual circumstances before making any financial decisions. Past performance is not necessarily indicative of future results.

Hypothetical Performance Disclosure: Hypothetical performance results have many inherent limitations, some of which are described below. No representation is being made that any account will or is likely to achieve profits or losses similar to those shown; in fact, there are frequently sharp differences between hypothetical performance results and the actual results subsequently achieved by any particular trading program. One of the limitations of hypothetical performance results is that they are generally prepared with the benefit of hindsight. In addition, hypothetical trading does not involve financial risk, and no hypothetical trading record can completely account for the impact of financial risk of actual trading. for example, the ability to withstand losses or to adhere to a particular trading program in spite of trading losses are material points which can also adversely affect actual trading results. There are numerous other factors related to the markets in general or to the implementation of any specific trading program which cannot be fully accounted for in the preparation of hypothetical performance results and all which can adversely affect trading results.

Testimonial Disclosure: Testimonials appearing on this website may not be representative of other clients or customers and is not a guarantee of future performance or success.