Products
SentimenTrader Trading Tools
‍
Backtest Engine
My Trading Toolkit
Correlation Analysis
Seasonality
Market Prediction
Indicators & Data API
‍
Proprietary Indicators & Charts
Market Data API
Strategies & Scanner
‍
50+ Trading Strategies
Smart Stock Scanner
Smart Option Scanner
Research Reports
‍
Research Solutions
Reports Library
Free Resources
Simple Backtest Calculator
Simple Seasonality Calculator
The Kelly Criterion Calculator
Sentiment Geo Map
Public Research Reports
Education
Sentiment Indicators
Technical Indicators
Pricing
Company
About
In the News
Testimonials
Client Success Stories
Contact
Log inLoginSign up
< BACK TO ALL REPORTS

Investors Cycle Into Cyclicals, Tech

Jason Goepfert
2019-04-18
null

Cyclical rebound

Cyclical stocks got hit hard late last year, especially relative to defensive stocks. They’ve made an impressive rebound. The rate of change on the ratio of cyclical to defensive stocks has cycled from an extreme low to an extreme high.

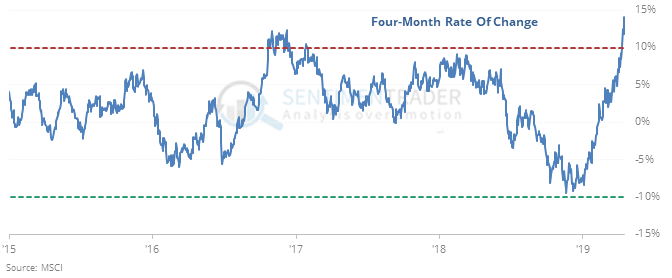
Over the past 20 years, a cycle like this has led to mean-reversion the few other times it happened to this degree, with defensive stocks outperforming by a significant degree.

Tech breakout

While buyers didn’t seem interested in chasing the Nasdaq 100’s breakout to a new high, at least on an intraday basis it bested its previous high by more than 0.5%, ending a streak of more than six months in a drawdown.

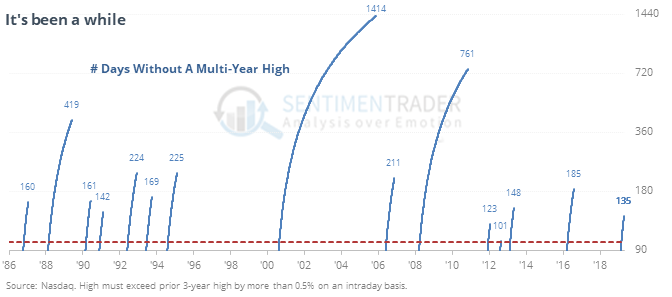
The other times that tech-heavy index ended such a long streak without a new high, it added to its gains in the months ahead almost every time. So did the S&P 500.

Exhausted

Single-day reversal patterns are fickle, so it’s hard to put much weight on Wednesday’s session. For what it’s worth, there have been 18 other times that SPY hit an intraday 52-week high then closed at its lowest level in four sessions. Over the next week, it rebounded 41% of the time with an average return of -0.1%. 

Rush to the exits

The Optimism Index on the XLV health care fund has plunged to a lowly 2. Since 2000, when it was at this level or lower, XLV rebounded over the next month after 45 of 54 attempts, averaging 5.1%, according to the Backtest Engine.

This post was an abridged version of our previous day's Daily Report. For full access, sign up for a 30-day free trial now.

PRODUCTS
SentimenTrader
Trading Tools
Indicators & Data API
‍
Strategies & Scanner
‍
Research Reports
FREE
RESOUrCES
Simple Backtest
Calculator
Simple Seasonality
Calculator
The Kelly Criterion
Calculator
Sentiment Geo Map
‍
Public Research Reports
‍
Education
Sentiment Indicators
‍
Technical Indicators
‍
Pricing
Bundle pricing
‍
FAQ
‍
Announcements
‍
COMPANY
‍
About
‍
In the News
‍
Testimonials
‍
Client Success Stories
CONTACT
‍
General Inquiries
‍
Media Inquiries
‍
Financial Professionals Inquiries
‍
© 2026 Sundial Capital Research Inc. All rights reserved.
Setsail Marketing
TermsPrivacyAffiliate Program
Risk Disclosure: The information and tools provided are for research and analytical purposes only and are not intended as investment advice. Market analysis involves uncertainty, and outcomes may differ from expectations. Users should conduct their own due diligence and consider their individual circumstances before making any financial decisions. Past performance is not necessarily indicative of future results.

Hypothetical Performance Disclosure: Hypothetical performance results have many inherent limitations, some of which are described below. No representation is being made that any account will or is likely to achieve profits or losses similar to those shown; in fact, there are frequently sharp differences between hypothetical performance results and the actual results subsequently achieved by any particular trading program. One of the limitations of hypothetical performance results is that they are generally prepared with the benefit of hindsight. In addition, hypothetical trading does not involve financial risk, and no hypothetical trading record can completely account for the impact of financial risk of actual trading. for example, the ability to withstand losses or to adhere to a particular trading program in spite of trading losses are material points which can also adversely affect actual trading results. There are numerous other factors related to the markets in general or to the implementation of any specific trading program which cannot be fully accounted for in the preparation of hypothetical performance results and all which can adversely affect trading results.

Testimonial Disclosure: Testimonials appearing on this website may not be representative of other clients or customers and is not a guarantee of future performance or success.