Products
SentimenTrader Trading Tools
‍
Backtest Engine
My Trading Toolkit
Correlation Analysis
Seasonality
Indicators & Data API
‍
Proprietary Indicators & Charts
Market Data API
Strategies & Scanner
‍
50+ Trading Strategies
Smart Stock Scanner
Research Reports
‍
Research Solutions
Reports Library
Free Resources
Simple Backtest Calculator
Simple Seasonality Calculator
The Kelly Criterion Calculator
Sentiment Geo Map
Public Research Reports
Pricing
Company
About
In the News
Testimonials
Client Success Stories
Contact
Log inLoginSign up
< BACK TO ALL REPORTS

Investors are getting more anxious on smaller declines

Jason Goepfert
2022-01-20
Traders are getting more and more anxious on smaller declines. The SMH semiconductor fund is showing modest pessimism in an uptrend.

Investors are getting more anxious on smaller declines

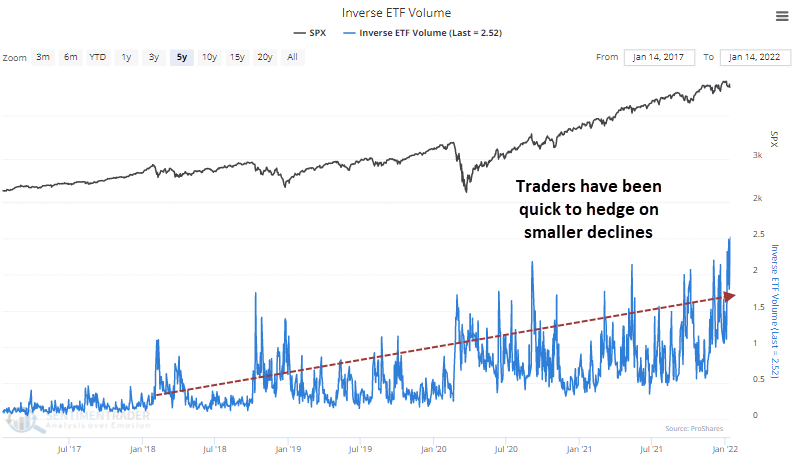
There have been some worrying signs lately. Rallies are being met with less and less enthusiasm, while declines, even tiny ones, are greeted with high anxiety.

On the surface, this could be a good thing and sometimes is. Knee-jerk contrarianism can work, especially in solid trends. But we've seen an extended period now where good news is being met with a collective yawn, or even aggressive selling pressure, while bad news is being exaggerated and extrapolated.

The anxiety has reached a point where inverse ETF volume, funds that profit when stocks decline, reached a record high on Friday. The 5-day average is now 20% higher than the previous peak from October 2021. Each successive dip has coincided with higher and higher anxiety. We can blame the new cadre of retail traders, but it's deeper than that.

Inverse ETF volume is increasing

Corporate insiders have not been interested in buying stock in their own companies, more stocks are falling into bear markets, fewer are holding above their long-term trendlines, and more are hitting 52-week lows.

All of this can be seen in the increasingly hesitant amount of risk behavior. Since September, our Risk-On / Risk-Off Indicator has had a series of lower highs and lower lows and the spread between Smart Money and Dumb Money Confidence has been diverging from the S&P 500.

Stat box

The Nasdaq Composite fell below its 200-day moving average for the first time in more than 400 days, ending the 3rd-longest streak above its 200-day average in its history.


An option setup in semis

In addition to a favorable seasonal trend, Jay noted that the SMH semiconductor fund Optimism Index has flashed a favorable sign recently. The red dots in the chart below display each time the 10-day average for SMH Optix has crossed above 40 while SMH was above its 200-day moving average.

SMH semiconductor optimism buy signal

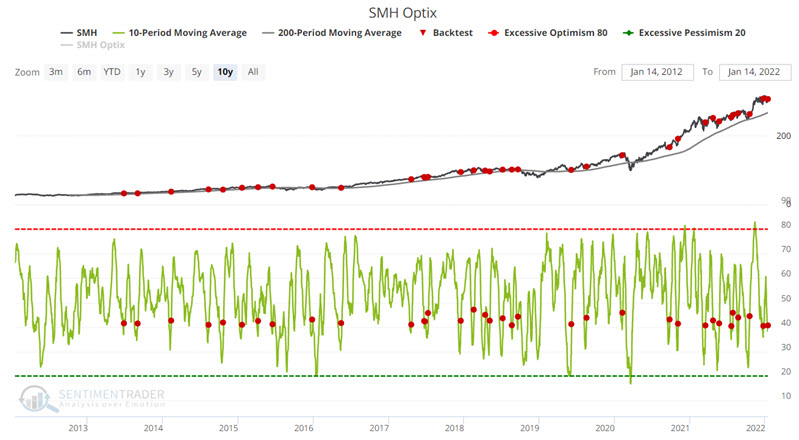
After the other signals, SMH has been higher 1-month later 79% of the time with an average gain of 3.44%. Based on these two favorable indications, a trader might consider a bullish position on semiconductors, so Jay outlined the risks and rewards of a potential option position in the fun.

PRODUCTS
SentimenTrader
Trading Tools
Indicators & Data API
‍
Strategies & Scanner
‍
Research Reports
FREE
RESOUrCES
Simple Backtest
Calculator
Simple Seasonality
Calculator
The Kelly Criterion
Calculator
Sentiment Geo Map
‍
Public Research Reports
‍
Pricing
Bundle pricing
‍
Announcements
‍
FAQ
COMPANY
‍
About
‍
In the News
‍
Testimonials
‍
Client Success Stories
CONTACT
‍
General Inquiries
‍
Media Inquiries
‍
Financial Professionals Inquiries
‍
© 2025 Sundial Capital Research Inc. All rights reserved.
Setsail Marketing
TermsPrivacyAffiliate Program
Risk Disclosure: Futures and forex trading contains substantial risk and is not for every investor. An investor could potentially lose all or more than the initial investment. Risk capital is money that can be lost without jeopardizing ones’ financial security or life style. Only risk capital should be used for trading and only those with sufficient risk capital should consider trading. Past performance is not necessarily indicative of future results.

Hypothetical Performance Disclosure: Hypothetical performance results have many inherent limitations, some of which are described below. No representation is being made that any account will or is likely to achieve profits or losses similar to those shown; in fact, there are frequently sharp differences between hypothetical performance results and the actual results subsequently achieved by any particular trading program. One of the limitations of hypothetical performance results is that they are generally prepared with the benefit of hindsight. In addition, hypothetical trading does not involve financial risk, and no hypothetical trading record can completely account for the impact of financial risk of actual trading. for example, the ability to withstand losses or to adhere to a particular trading program in spite of trading losses are material points which can also adversely affect actual trading results. There are numerous other factors related to the markets in general or to the implementation of any specific trading program which cannot be fully accounted for in the preparation of hypothetical performance results and all which can adversely affect trading results.

Testimonial Disclosure: Testimonials appearing on this website may not be representative of other clients or customers and is not a guarantee of future performance or success.