Products
SentimenTrader Trading Tools
‍
Backtest Engine
My Trading Toolkit
Correlation Analysis
Seasonality
Indicators & Data API
‍
Proprietary Indicators & Charts
Market Data API
Strategies & Scanner
‍
50+ Trading Strategies
Smart Stock Scanner
Research Reports
‍
Research Solutions
Reports Library
Free Resources
Simple Backtest Calculator
Simple Seasonality Calculator
The Kelly Criterion Calculator
Sentiment Geo Map
Public Research Reports
Pricing
Company
About
In the News
Testimonials
Client Success Stories
Contact
Log inLoginSign up
< BACK TO ALL REPORTS

Investors across the board are hoarding cash

Jason Goepfert
2020-05-01
There has been a surge of assets flooding into money market funds, among mom-and-pop investors, institutions, and mutual fund managers. Usually, this has occurred well before markets bottom, though.

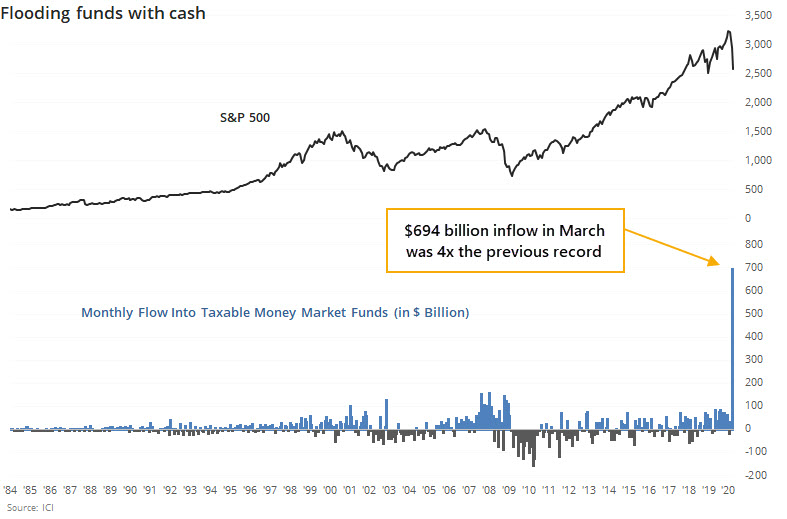
Investors have been shoving money into the safety of money markets on a scale never before seen. In March alone, they moved nearly $700 billion into these funds, more than four times any prior monthly inflow.

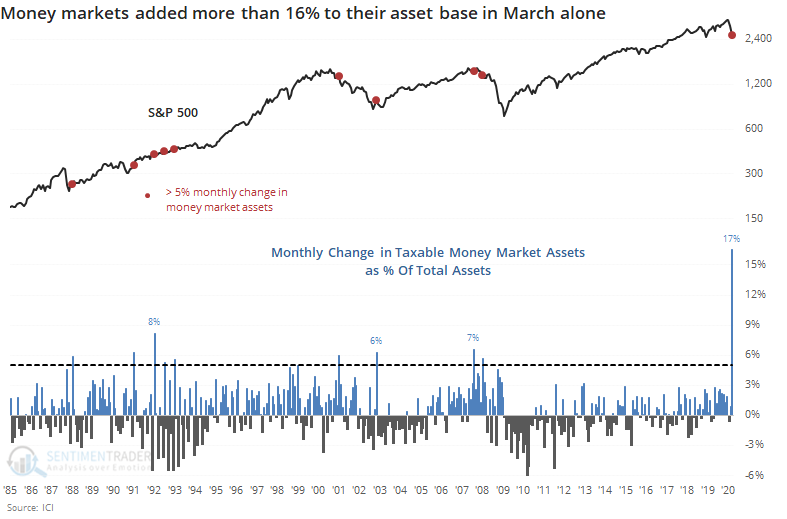
As a percentage of the asset base, the jump in March was still by far the most in 35 years.

The record of these flows is not consistent as a predictor. It led to universally higher prices prior to the last two bear markets, when it was woefully early.

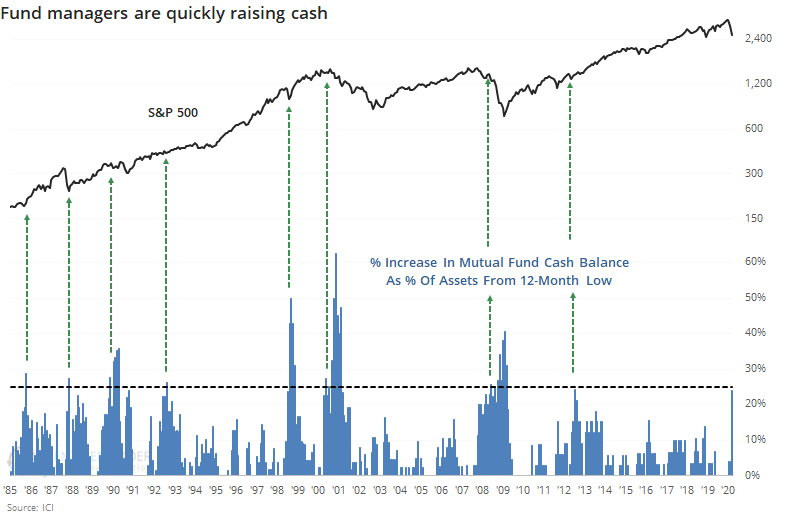
It's not just mom-and-pop investors. Institutions have been flooding money market funds, and mutual fund managers have raised the proportion of liquid assets in their funds. At 3.1% of total assets, it remains well below other periods of panic, even though the rate of change has been dramatic.

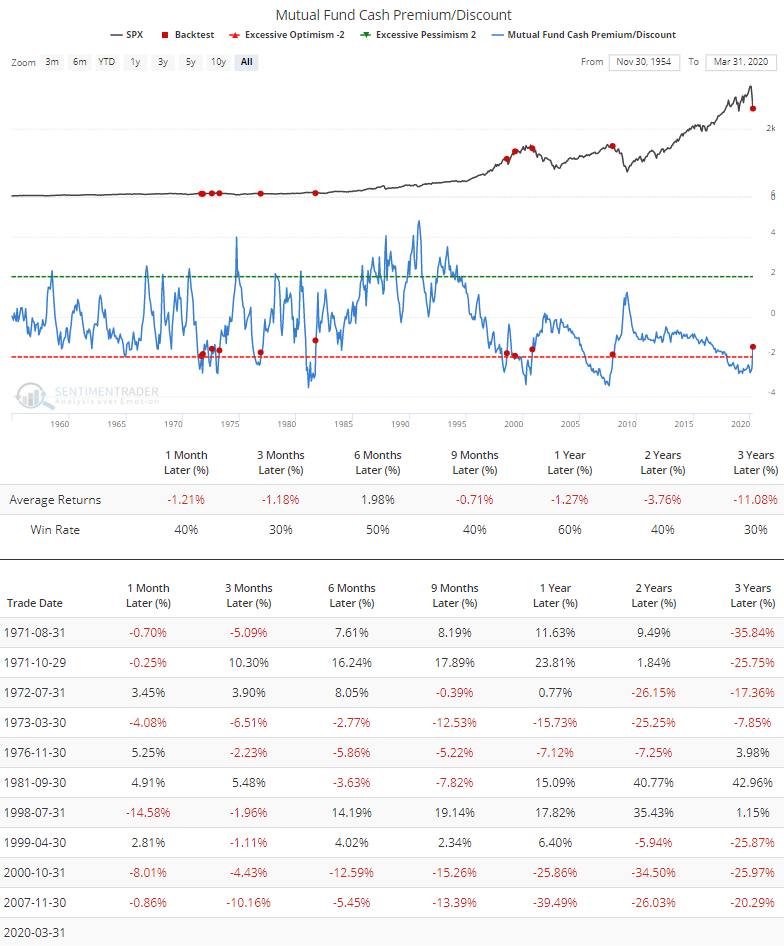
Because fund managers increased their liquid assets, and interest rates essentially went to zero, the Cash Premium/Discount improved dramatically from historic lows.

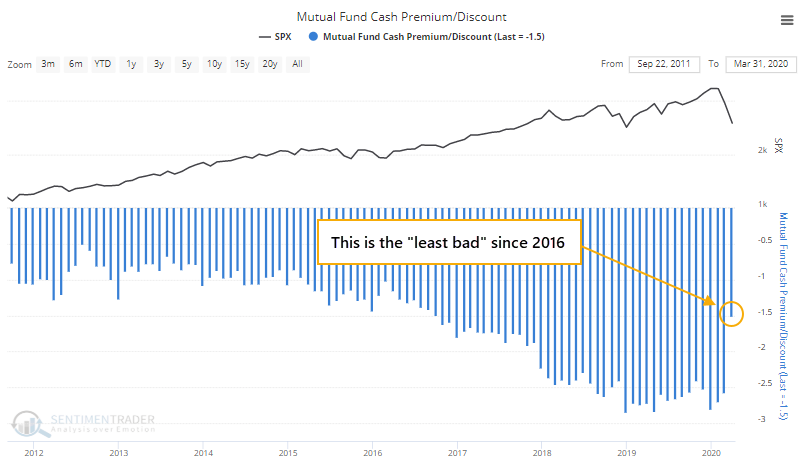
This is the start of being a good sign, with an emphasis on "start." According to the Backtest Engine, when this indicator has moved above -2, returns were unpleasant for quite a while.

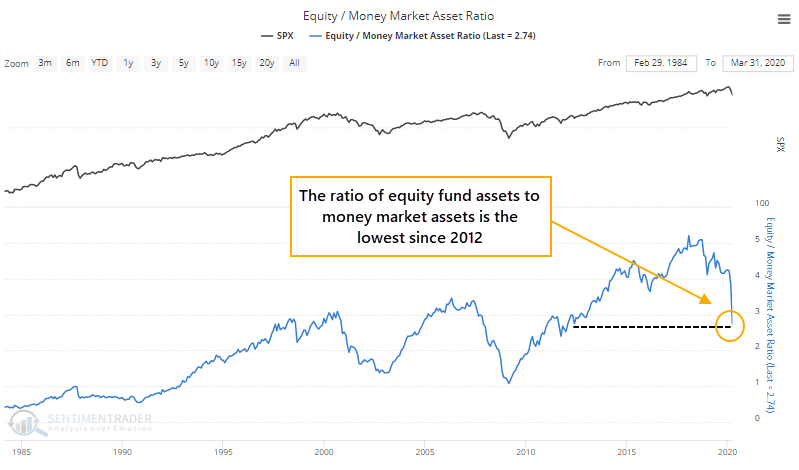
As a result of the plunge in equity assets and major inflow to money market funds, the ratio of assets in equities versus money markets has cratered to the lowest since 2012.

The percentage change in this ratio is dramatic, falling more than 40% from the peak. That's on par with the largest declines in 35 years.

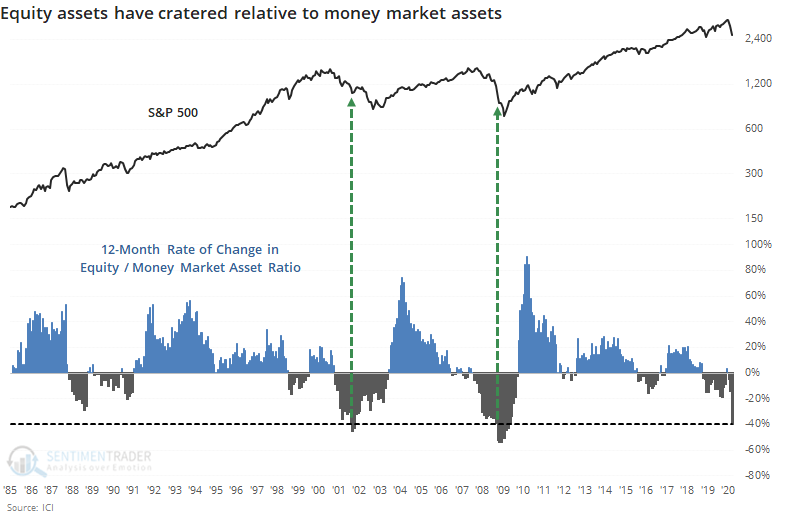
Just because the drop in the ratio has been historical doesn't necessarily mean it's a positive, at least right away. Both of the other times it declined by this month, stocks still had further to fall in the months ahead before finding a long-term bottom.

Most of the fundamental data points, and fiscal and monetary policy adjustments, are beyond what we saw near the ends of past bear markets. This decline happened so fast, though, that many investors are just catching up. So when we look at data like fund flows, especially those released with a lag, we're only seeing the kind of activity that previously triggered near the beginning of past bear markets. Based on this data in isolation, it's extreme, but not actionable. It would take more months of heavy outflows from stocks and inflows to money markets to equate to the kinds of readings we more commonly saw at or near the ends of other bear markets, especially the last two.

Sorry, you don't have access to this report

Upgrade your subscription plan to get access
Go to Dasboard
PRODUCTS
SentimenTrader
Trading Tools
Indicators & Data API
‍
Strategies & Scanner
‍
Research Reports
FREE
RESOUrCES
Simple Backtest
Calculator
Simple Seasonality
Calculator
The Kelly Criterion
Calculator
Sentiment Geo Map
‍
Public Research Reports
‍
Pricing
Bundle pricing
‍
Announcements
‍
FAQ
COMPANY
‍
About
‍
In the News
‍
Testimonials
‍
Client Success Stories
CONTACT
‍
General Inquiries
‍
Media Inquiries
‍
Financial Professionals Inquiries
‍
© 2025 Sundial Capital Research Inc. All rights reserved.
Setsail Marketing
TermsPrivacyAffiliate Program
Risk Disclosure: Futures and forex trading contains substantial risk and is not for every investor. An investor could potentially lose all or more than the initial investment. Risk capital is money that can be lost without jeopardizing ones’ financial security or life style. Only risk capital should be used for trading and only those with sufficient risk capital should consider trading. Past performance is not necessarily indicative of future results.

Hypothetical Performance Disclosure: Hypothetical performance results have many inherent limitations, some of which are described below. No representation is being made that any account will or is likely to achieve profits or losses similar to those shown; in fact, there are frequently sharp differences between hypothetical performance results and the actual results subsequently achieved by any particular trading program. One of the limitations of hypothetical performance results is that they are generally prepared with the benefit of hindsight. In addition, hypothetical trading does not involve financial risk, and no hypothetical trading record can completely account for the impact of financial risk of actual trading. for example, the ability to withstand losses or to adhere to a particular trading program in spite of trading losses are material points which can also adversely affect actual trading results. There are numerous other factors related to the markets in general or to the implementation of any specific trading program which cannot be fully accounted for in the preparation of hypothetical performance results and all which can adversely affect trading results.

Testimonial Disclosure: Testimonials appearing on this website may not be representative of other clients or customers and is not a guarantee of future performance or success.