
Investor Sentiment Toward Gold Remains Elevated Relative to Other Markets

Key Points:
- Market sentiment toward gold is higher than that of other major asset classes, including stocks, bonds, and crude oil.
- This marks the second consecutive year (following 2024) that investors have favored gold over other major markets.
- Historically, gold has delivered strong long-term performance following such signals.
Investors View Gold as Their Top Choice
Gold's recent push toward all-time highs over the past two days has boosted market sentiment. The yellow metal is becoming increasingly unignorable, with a growing number of investors taking notice. On our dashboard, despite a pullback in gold's sentiment indicators following a period of consolidation, investor sentiment toward gold remains higher than that of the other three major asset classes-stocks, bonds, and crude oil.
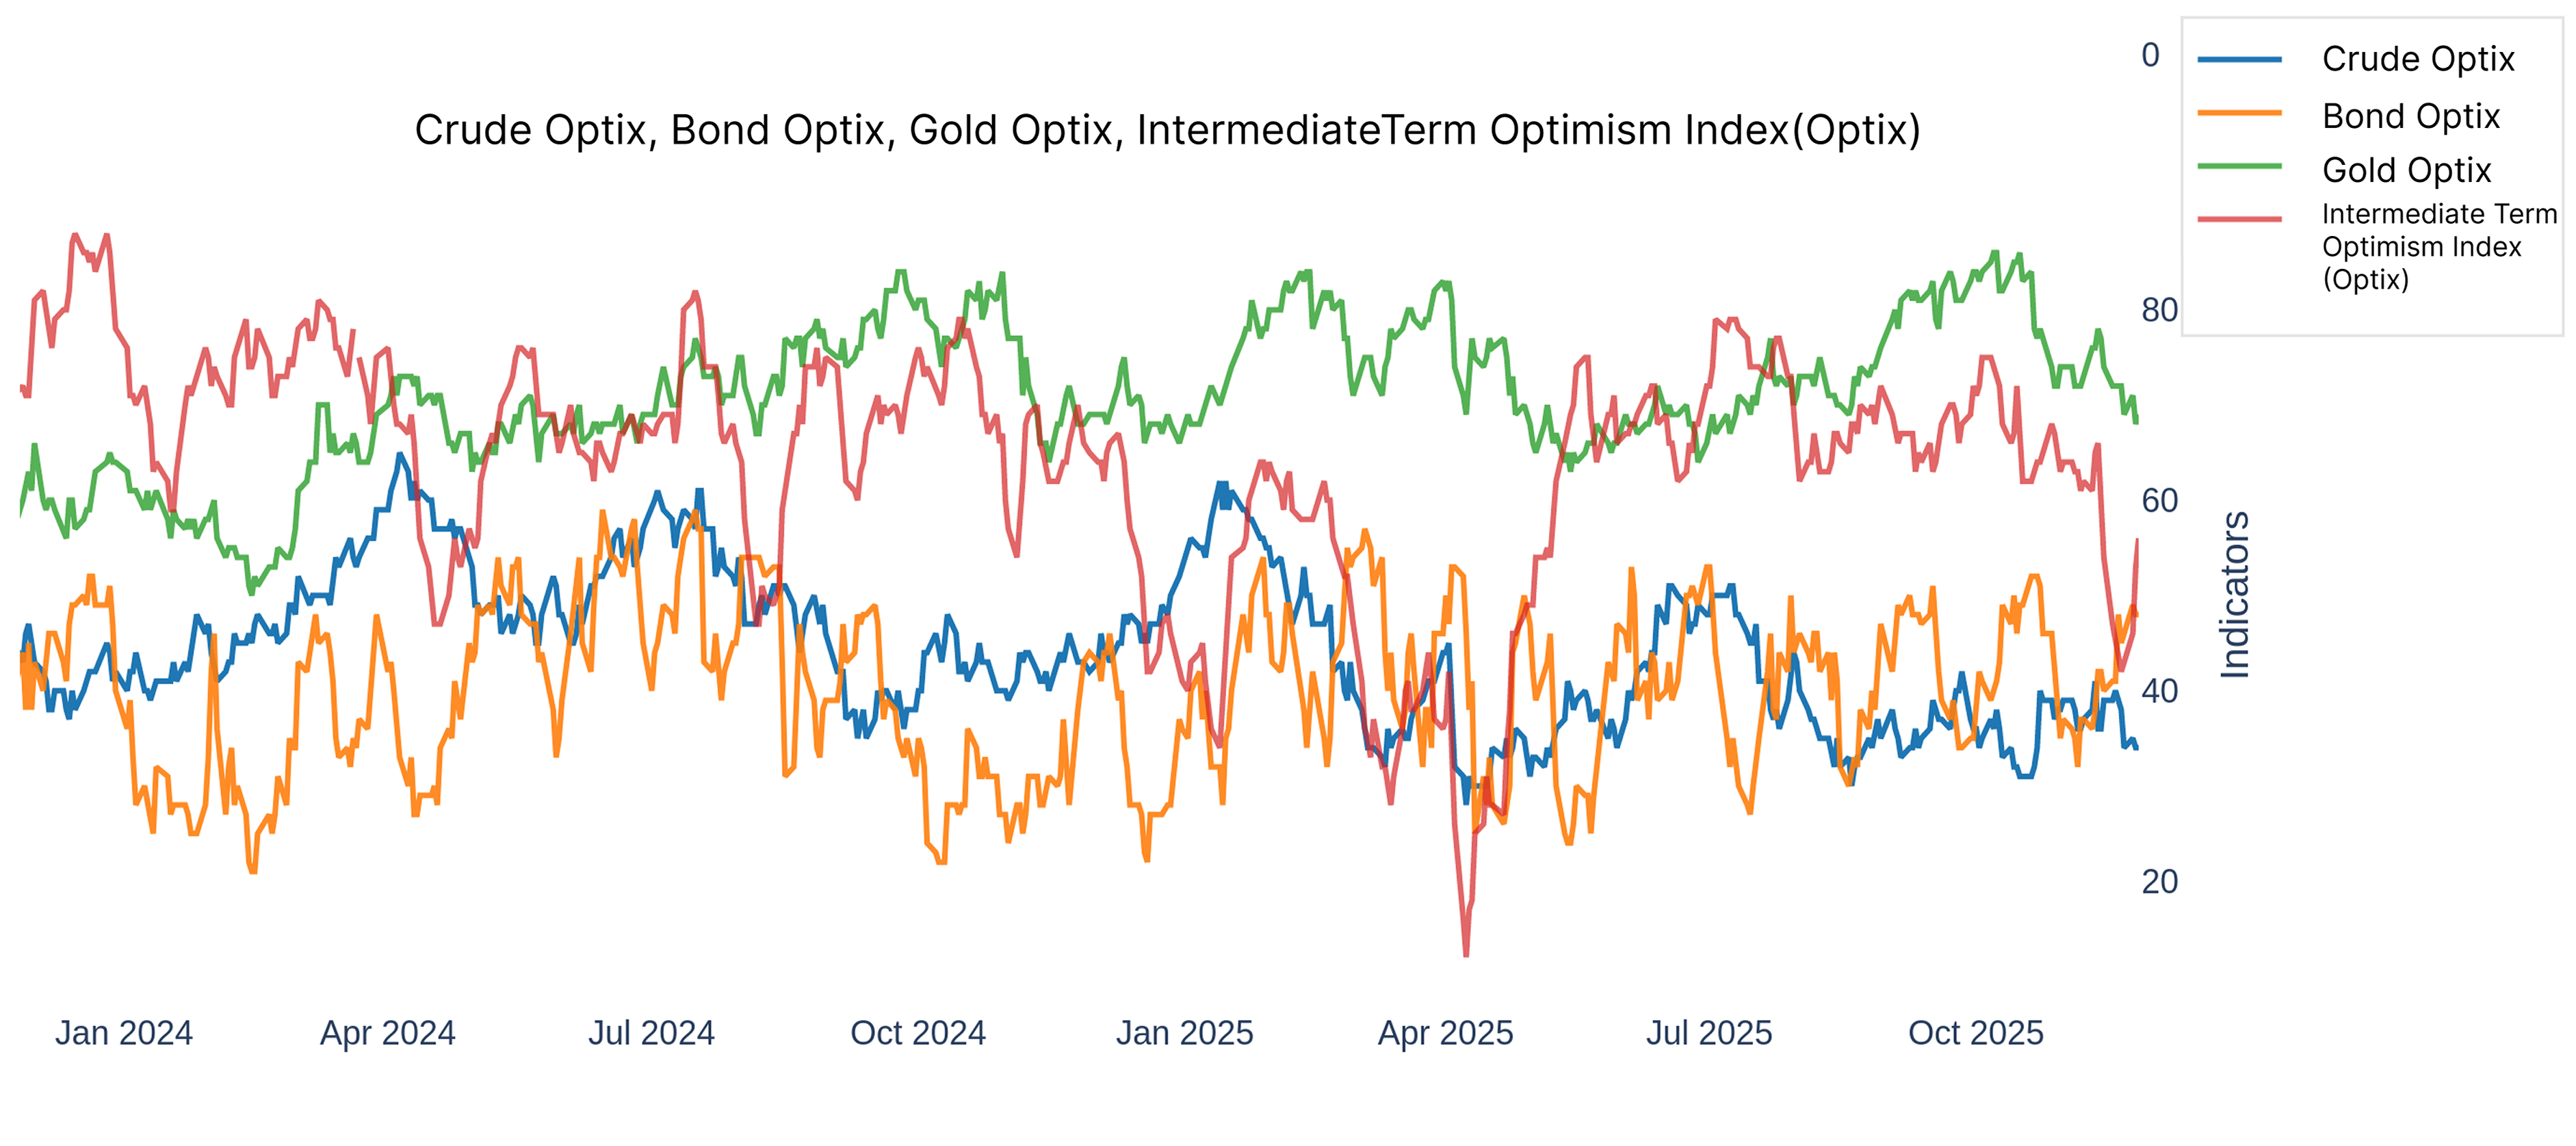
Optimism toward gold outpaces that of other major markets.Related Backtest Click Here.
This pattern has been frequent since the start of gold's rally in 2024.
Typically a Continuation of Gold's Long-Term Bull Market
The table below shows gold's returns during periods when investor expectations for gold were more optimistic than those for stocks, bonds, or oil-specifically, when gold's Optix was at least 20 points higher than the other three assets.
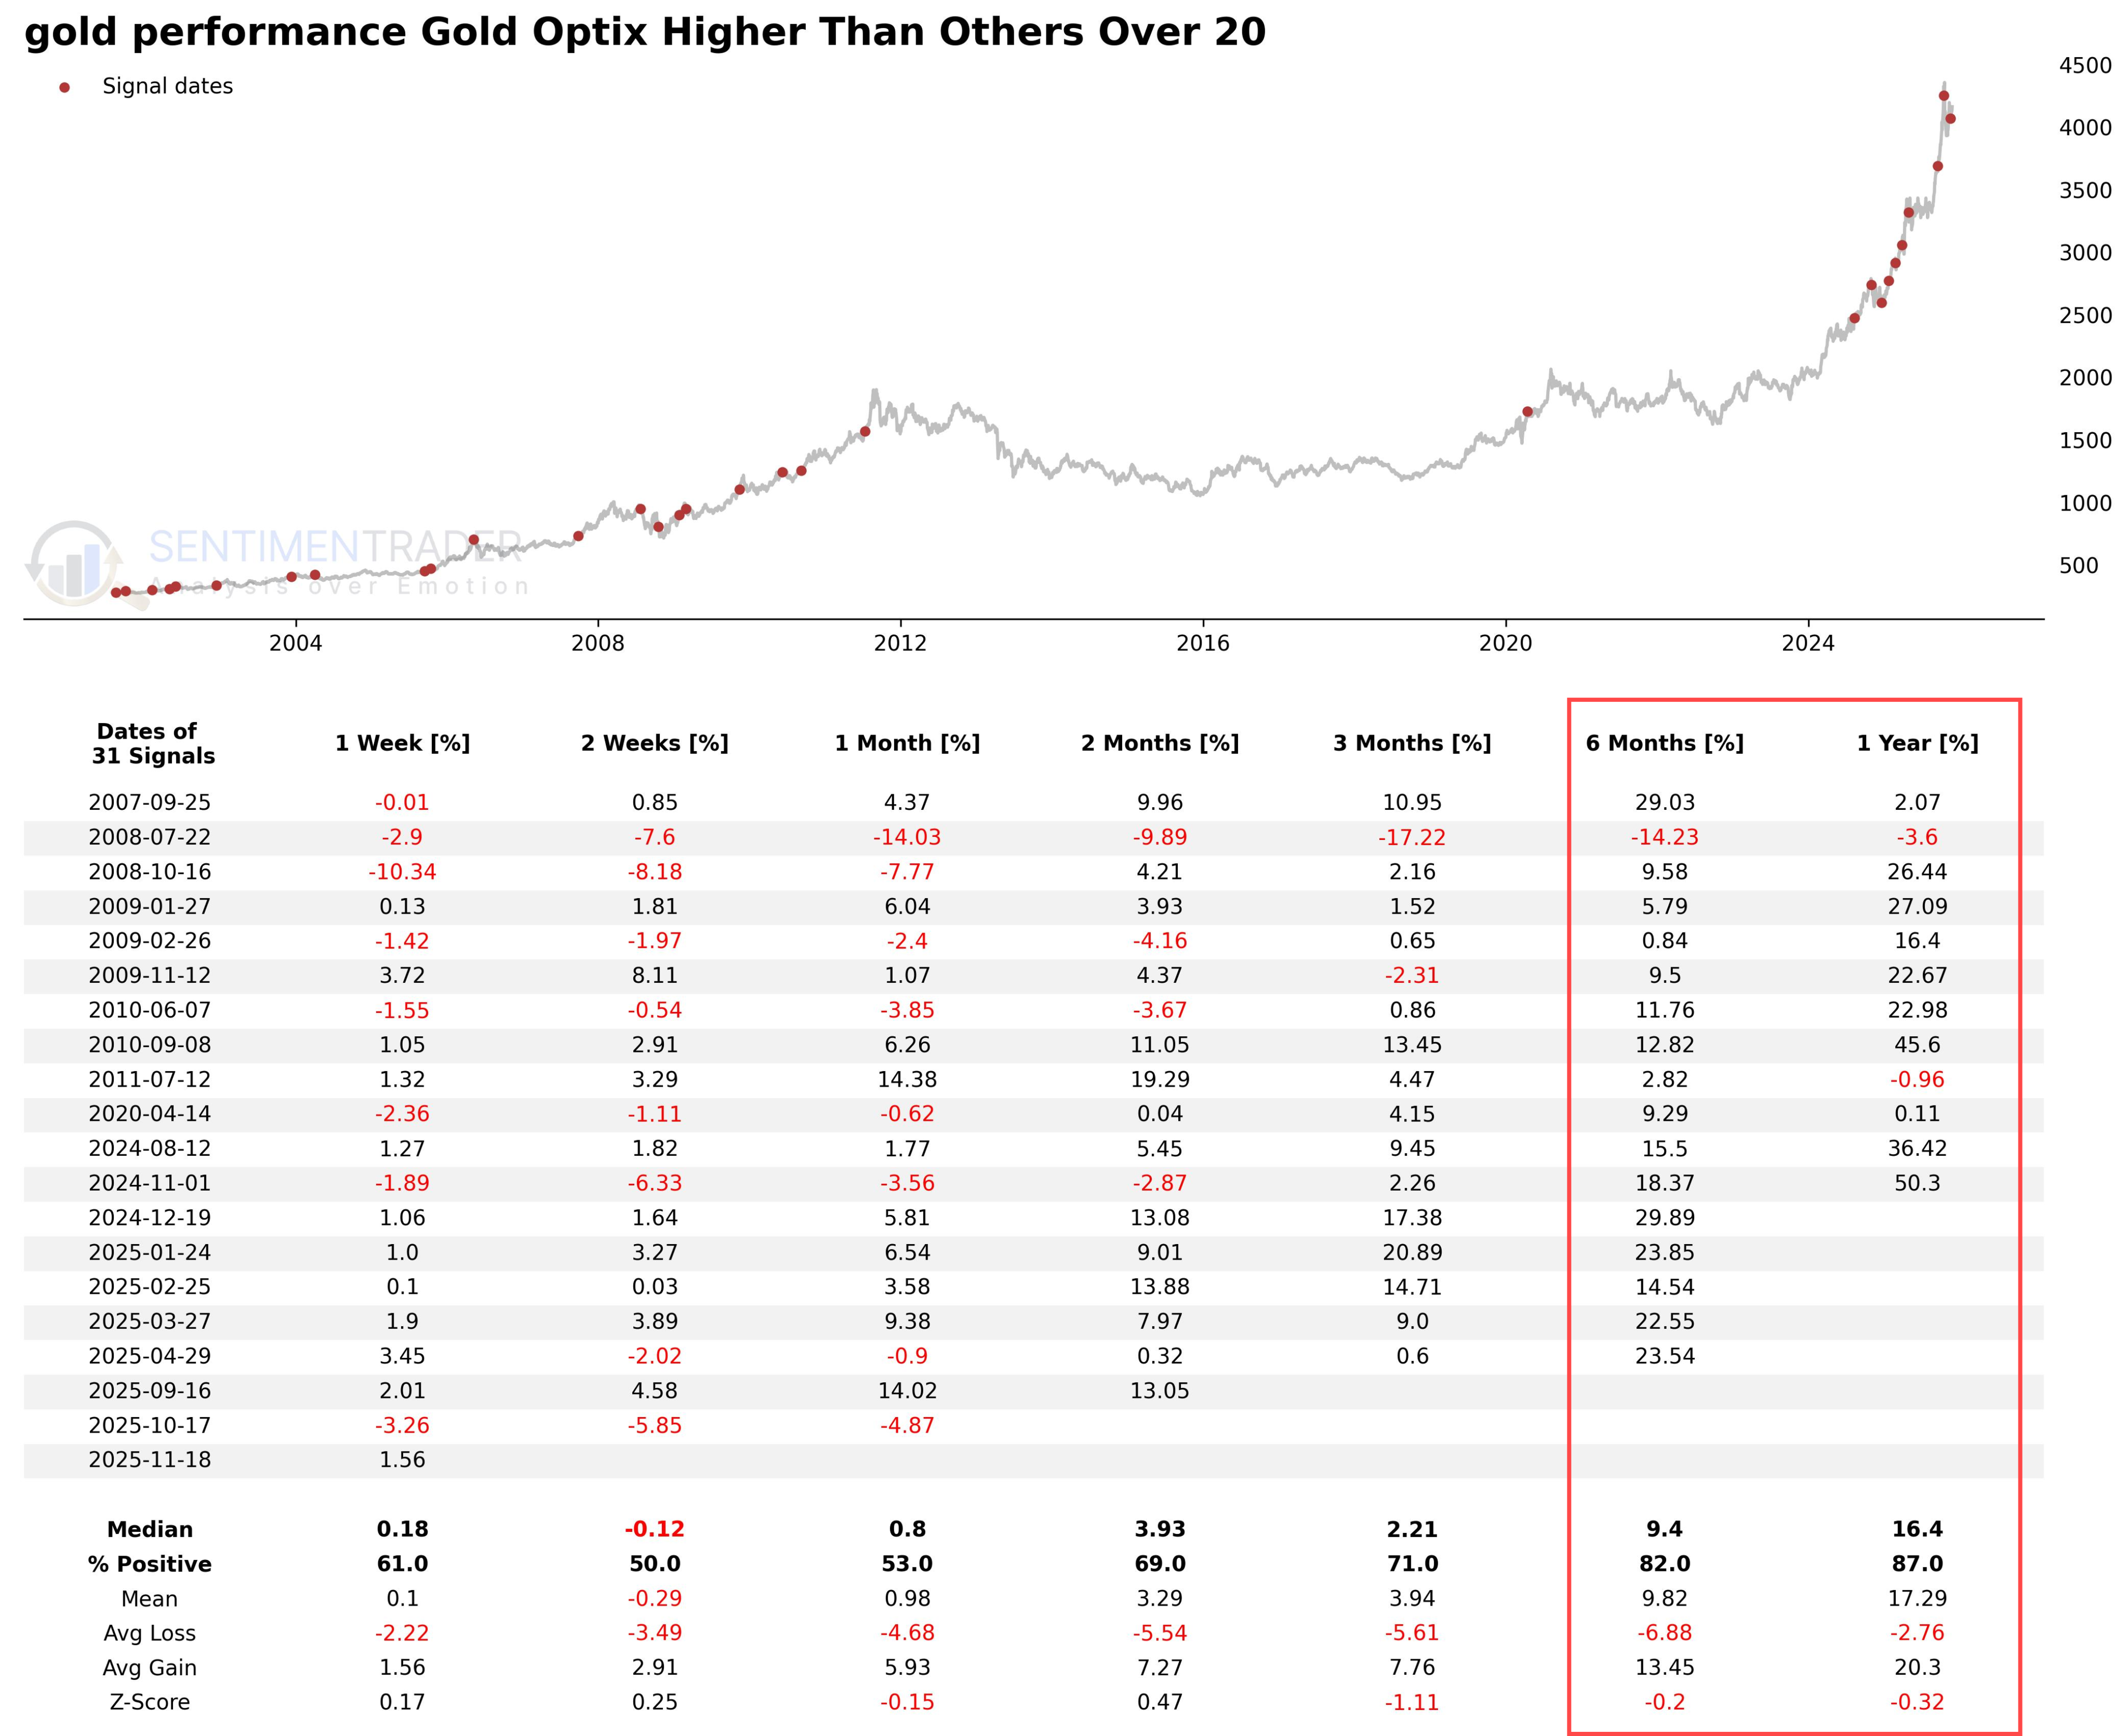
As the data illustrates, short-term returns are mixed-indicating that overcrowded bullish sentiment often requires digestion through short-term volatility or pullbacks. However, medium to long-term win rates for gold are impressive.
Notably, examining the price chart above, excluding black swan events like the 2008 financial crisis, the dense red signal points almost exclusively appear during sustained bull markets. This sentiment combination rarely occurs at the end of a rally or on the eve of a sharp decline; instead, it serves as confirmation of a strong trend continuation.
Gold Mining Stocks Require More Patience
Even amid strong gold price momentum, the mining sector often struggles to maintain upward momentum. Initially, this was also the case when investors favor gold over other assets.
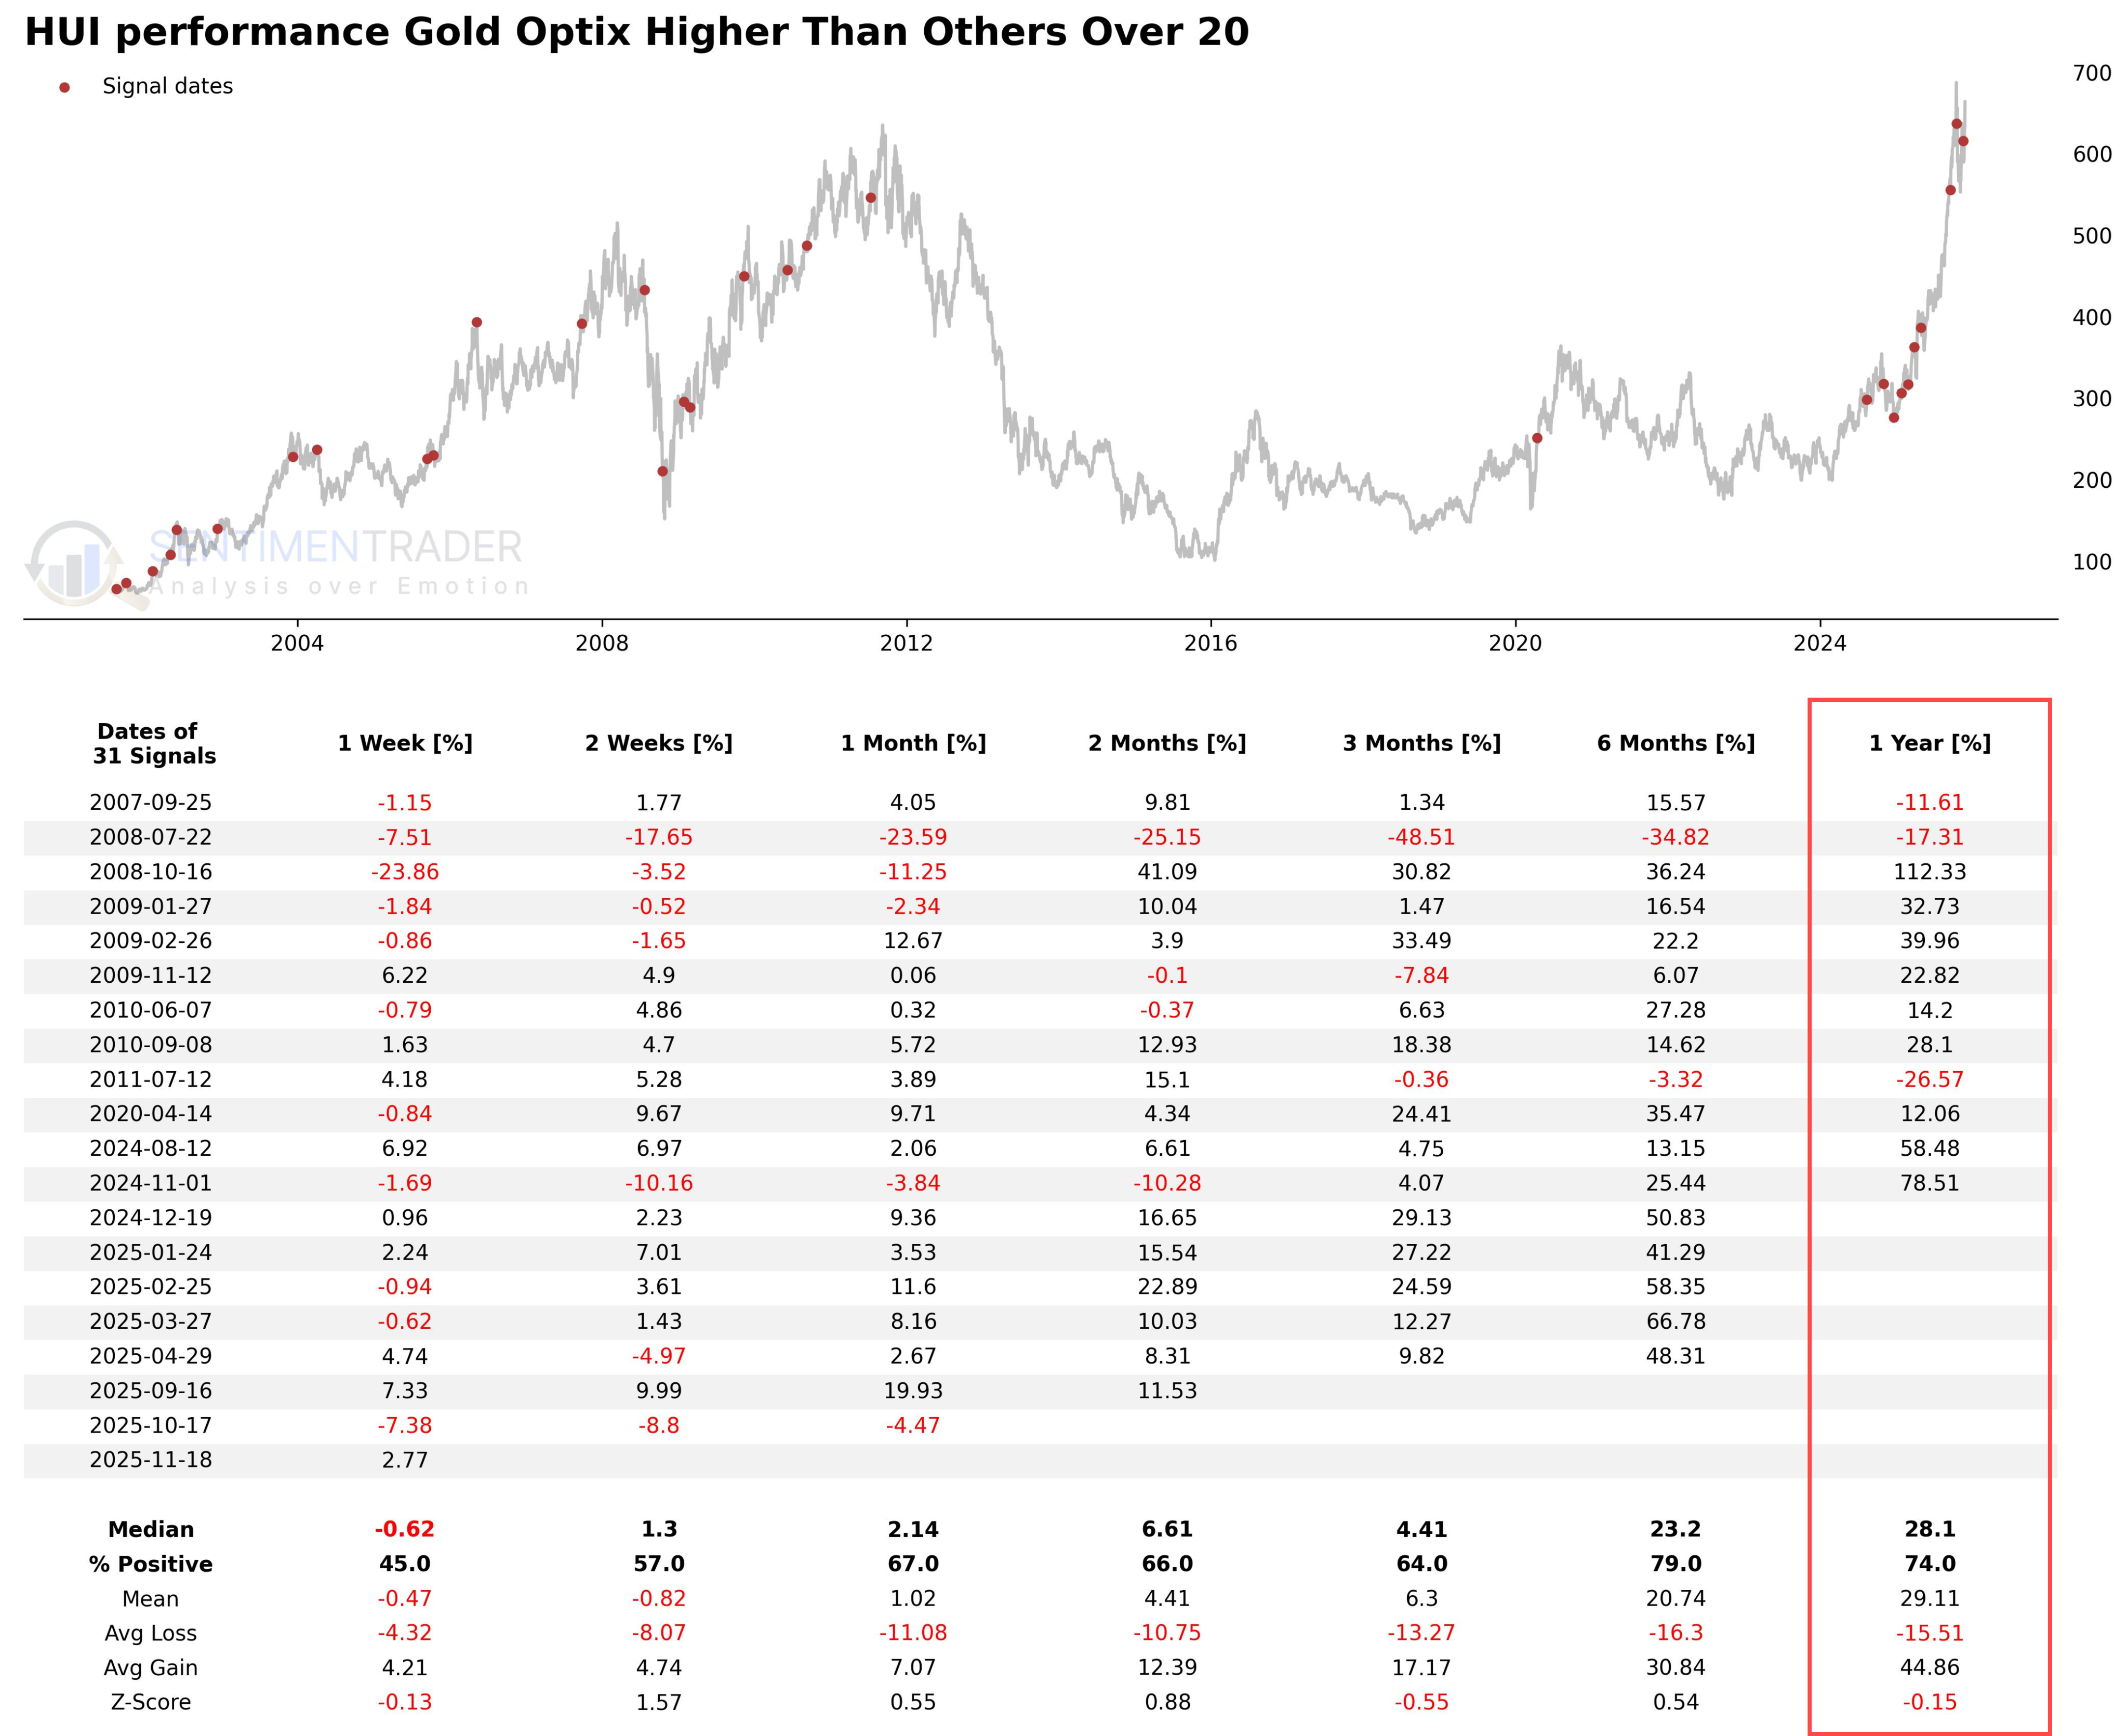
Data shows that in the first month following these signals, gold mining stocks deliver mediocre average returns, accompanied by pullback risks.
However, after this short period of lackluster performance, gold mining stocks exhibit more attractive risk-reward ratios and win rates over the subsequent 6-12 months. After one year, the average return for gold mining stocks reaches 22.3%-even outperforming physical gold itself. Nevertheless, during unfavorable macro conditions such as liquidity crises, signals in 2008 and 2011 demonstrate that mining stocks face severe penalties.
The Other Three Markets
Among the other three asset classes mentioned earlier, only crude oil keeps pace with gold when such signals are triggered.
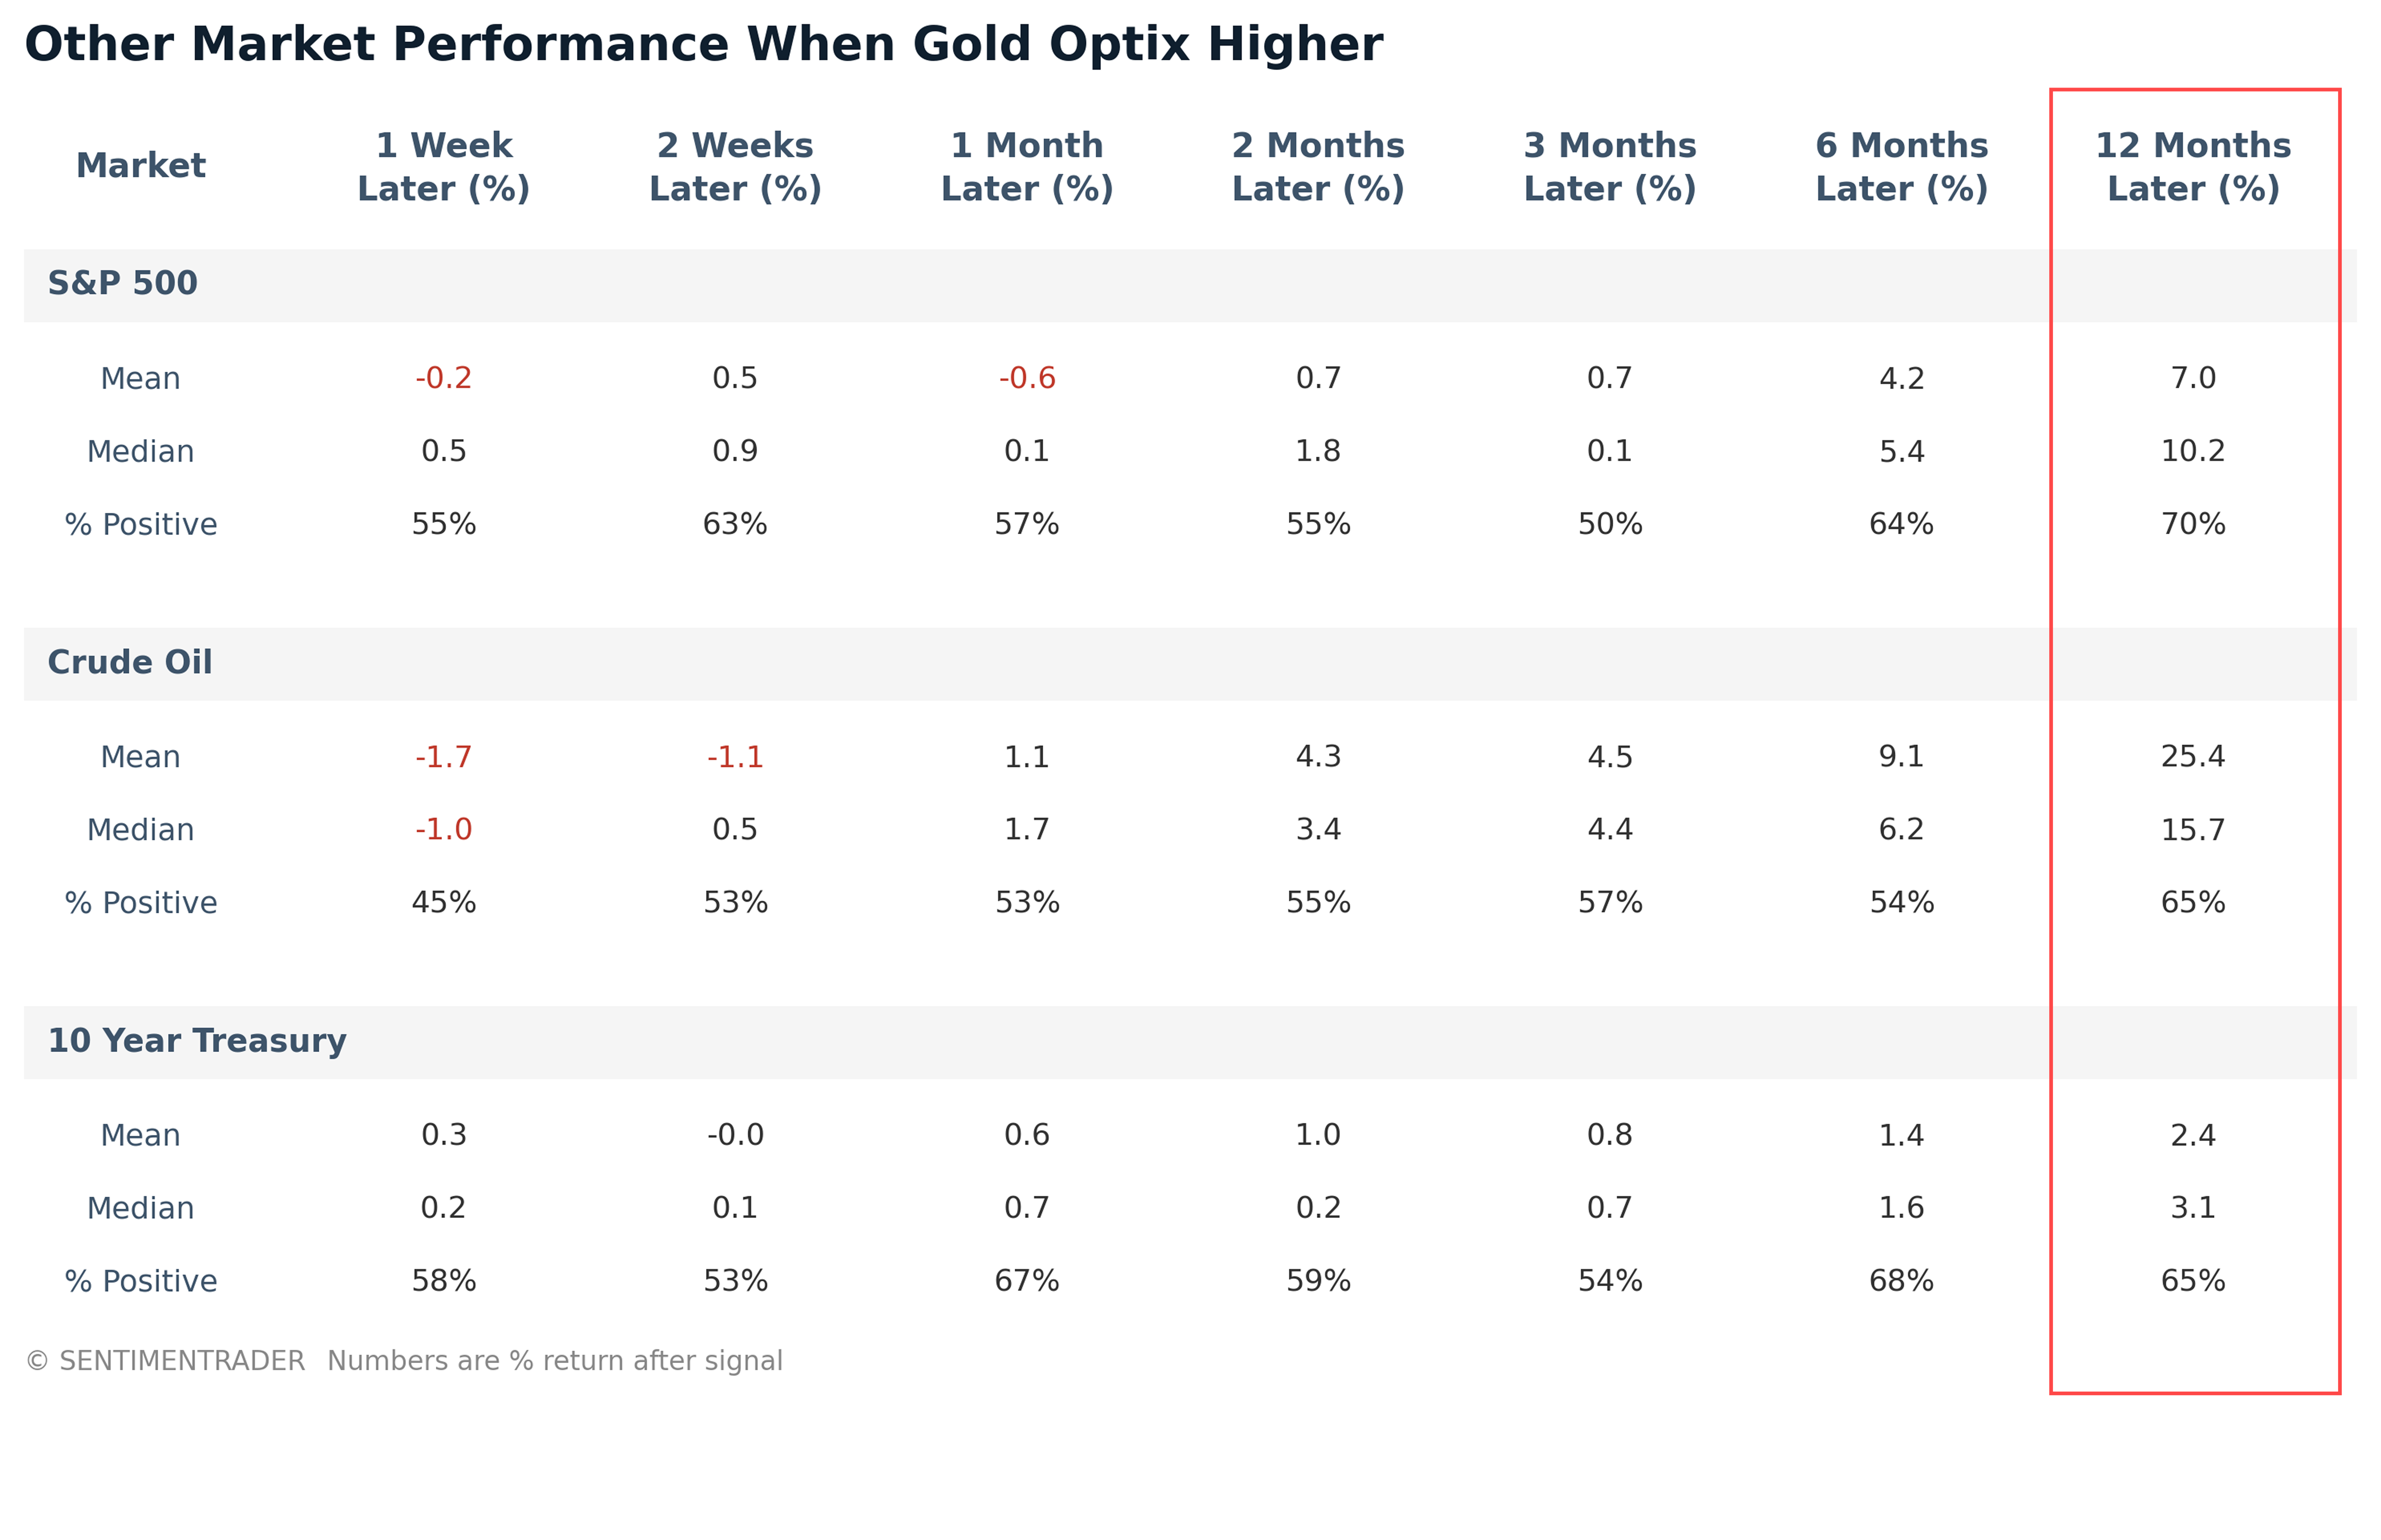
Crude oil delivers an average one-year return of 25.4%, joining gold in outperforming traditional markets. In contrast, traditional financial assets post lackluster performance.
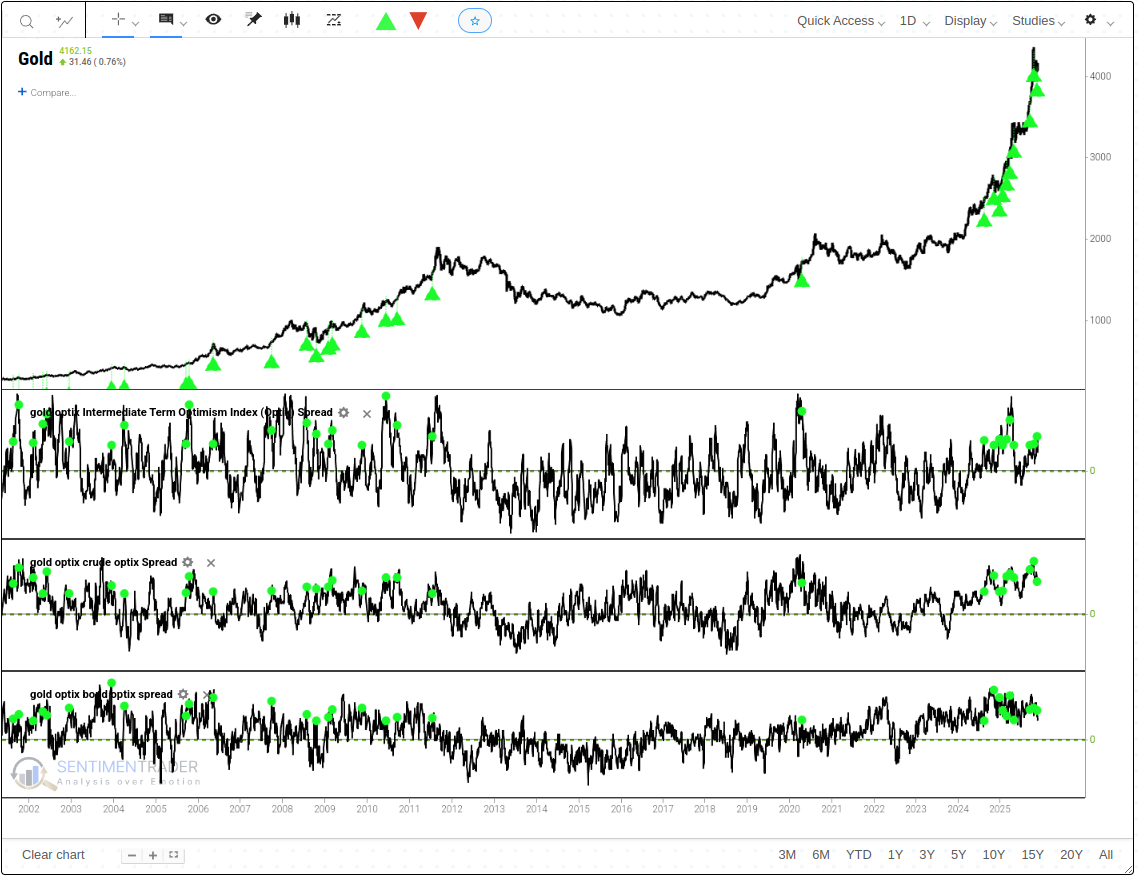
How Create Backtest
Step 1: Create three "Spread" type my_indicators for use in the backtest.
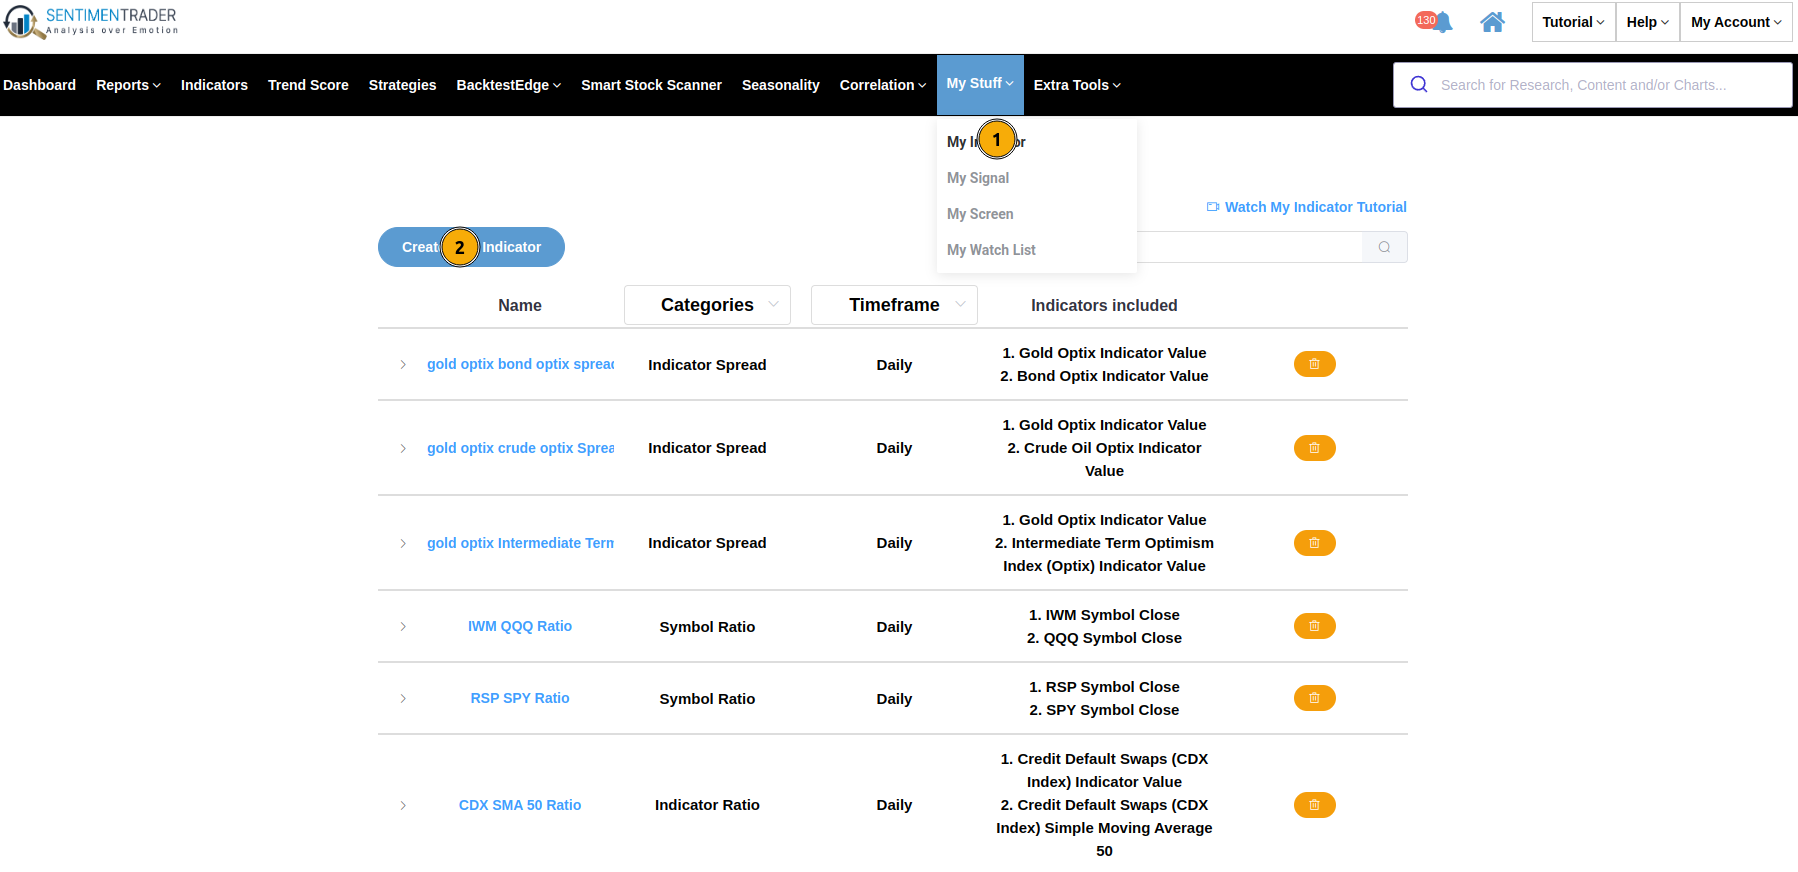
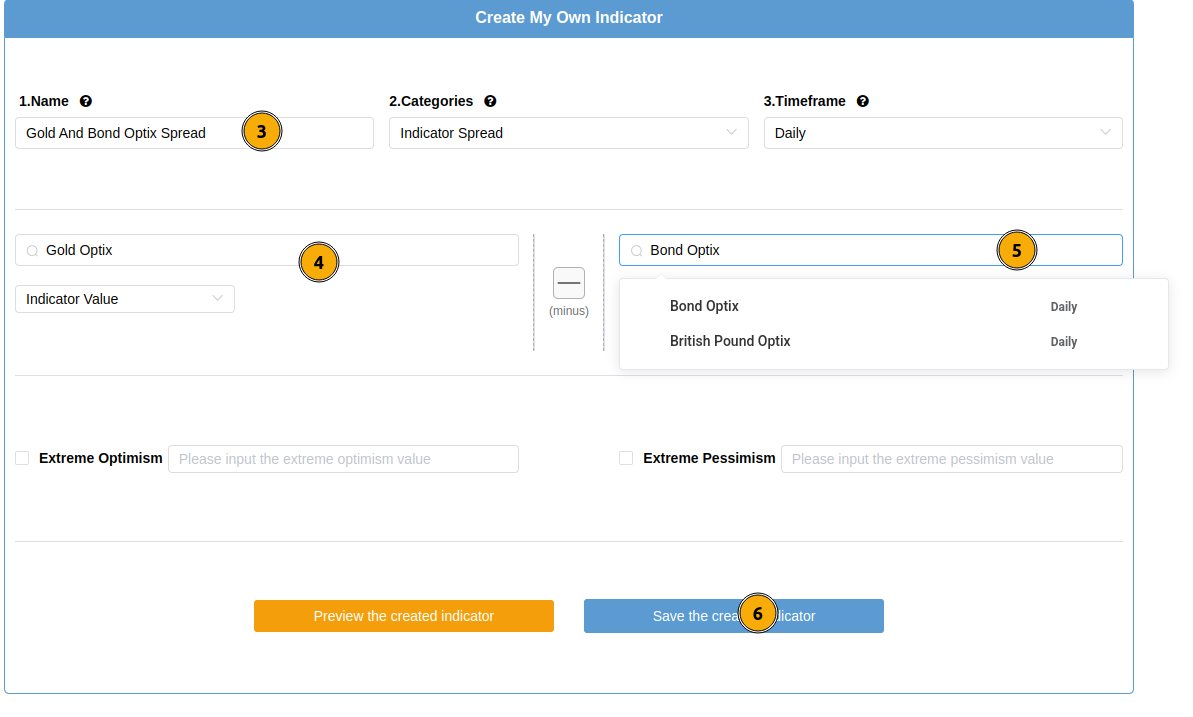
Create the first spread for Gold Optix vs. Bond Optix. Similarly, create the remaining two spreads: Gold Optix vs. Crude Oil Optix, and Gold Optix vs. Intermediate Term Optimism Index (Optix).
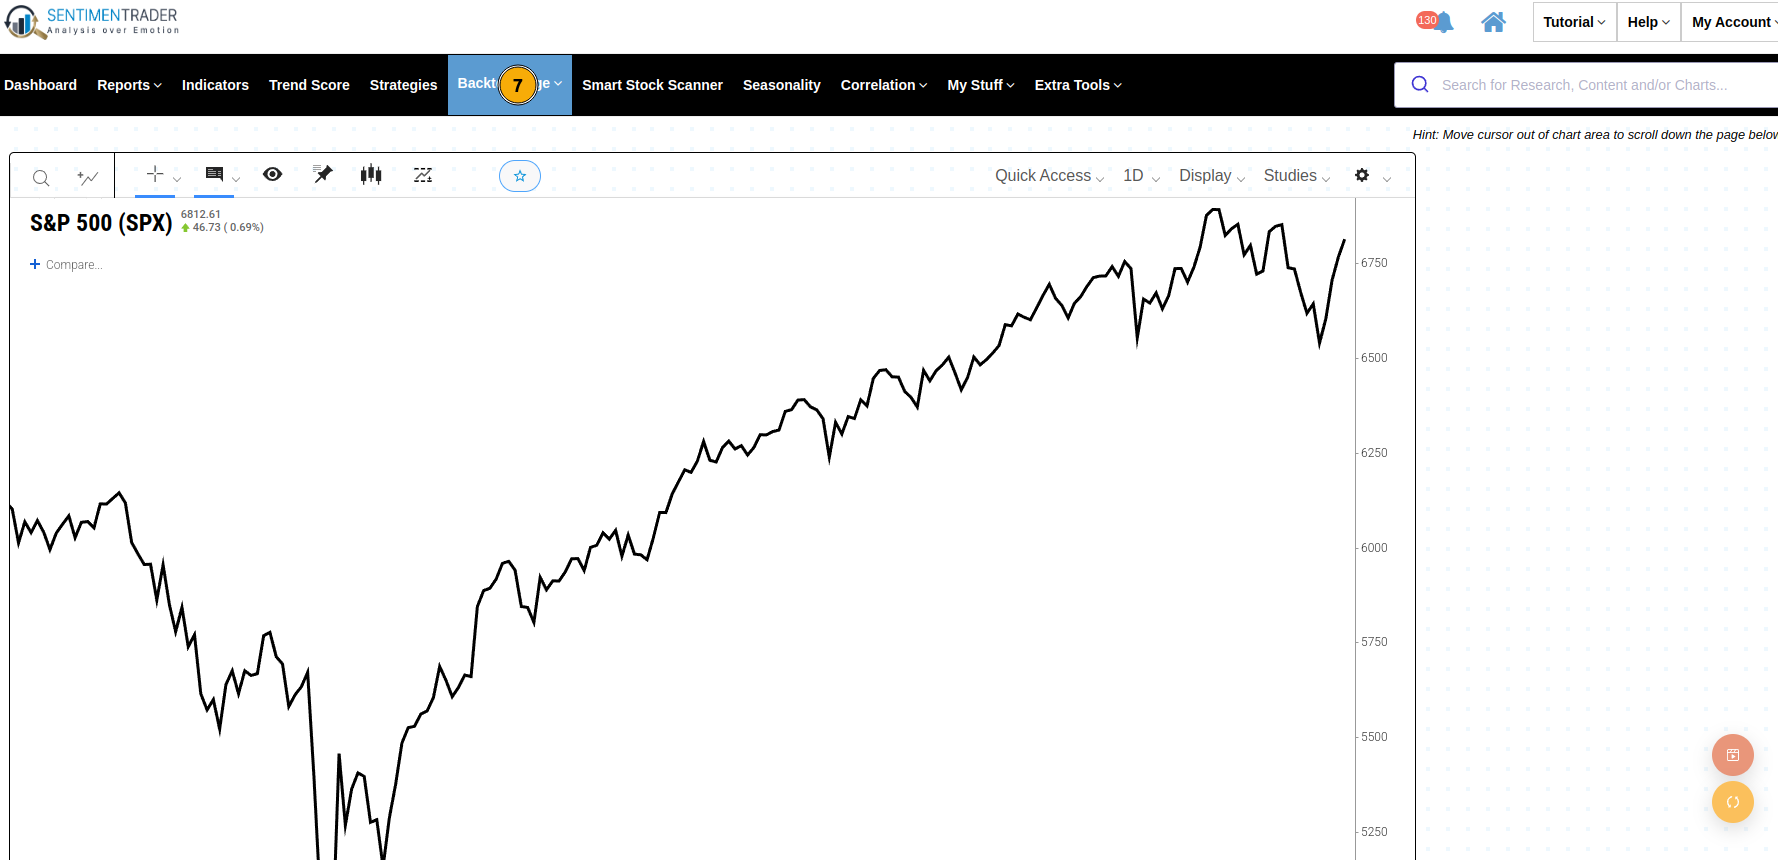
Step 2: Navigate back to our Backtest Engine.
Step 3: Populate the Entry Criteria.
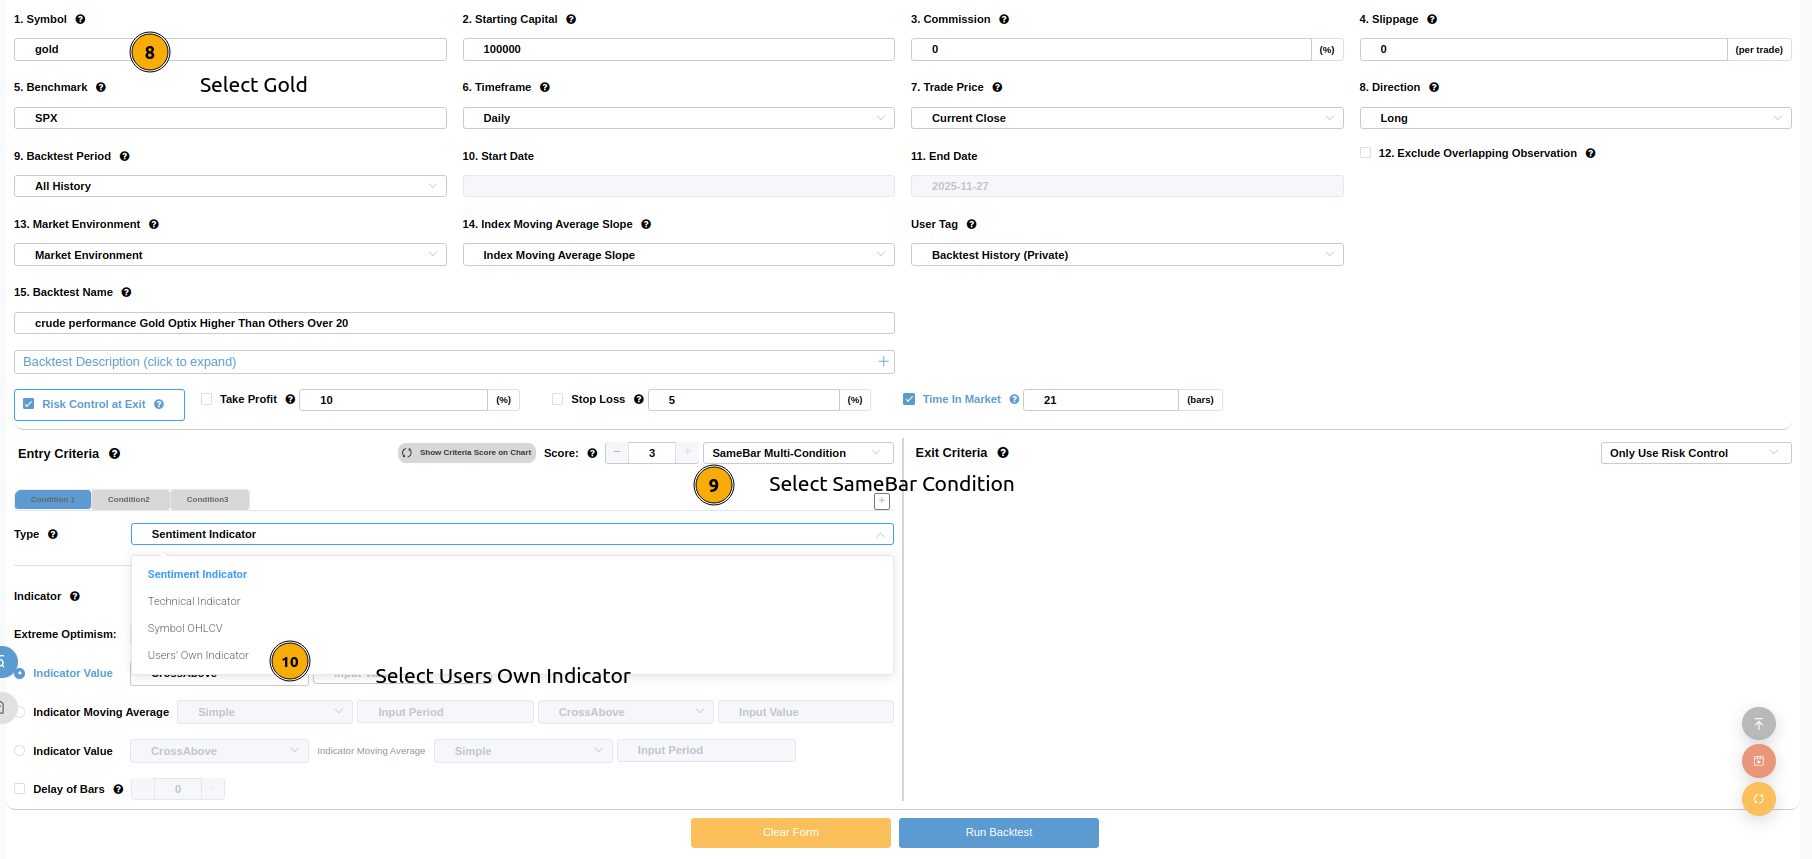
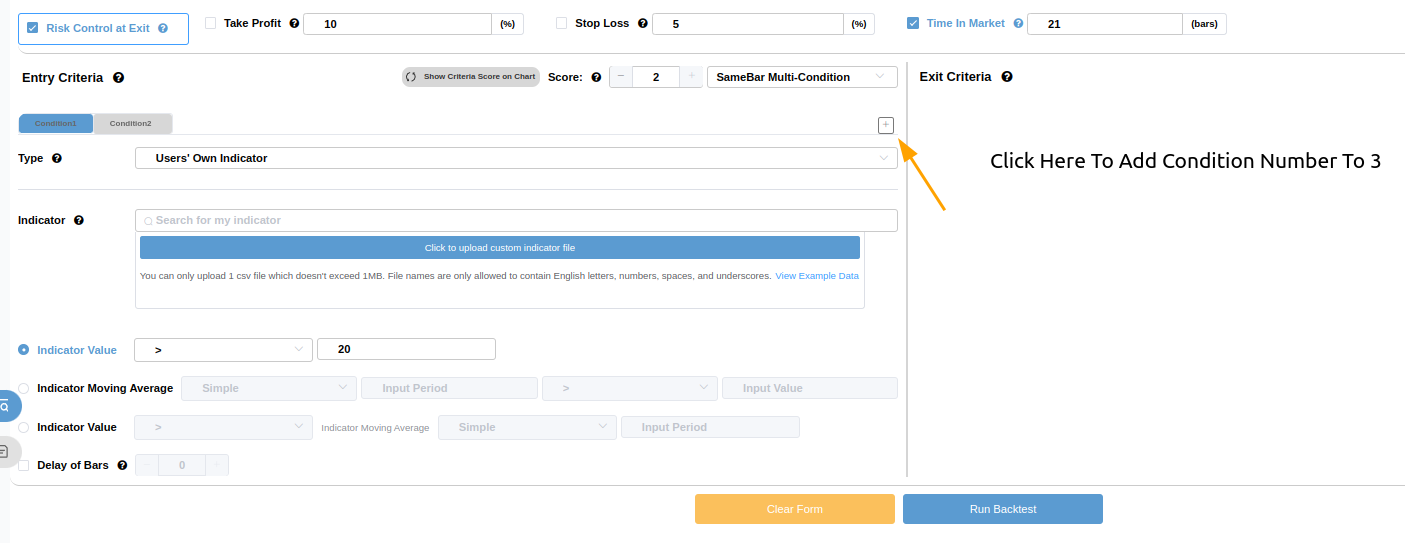
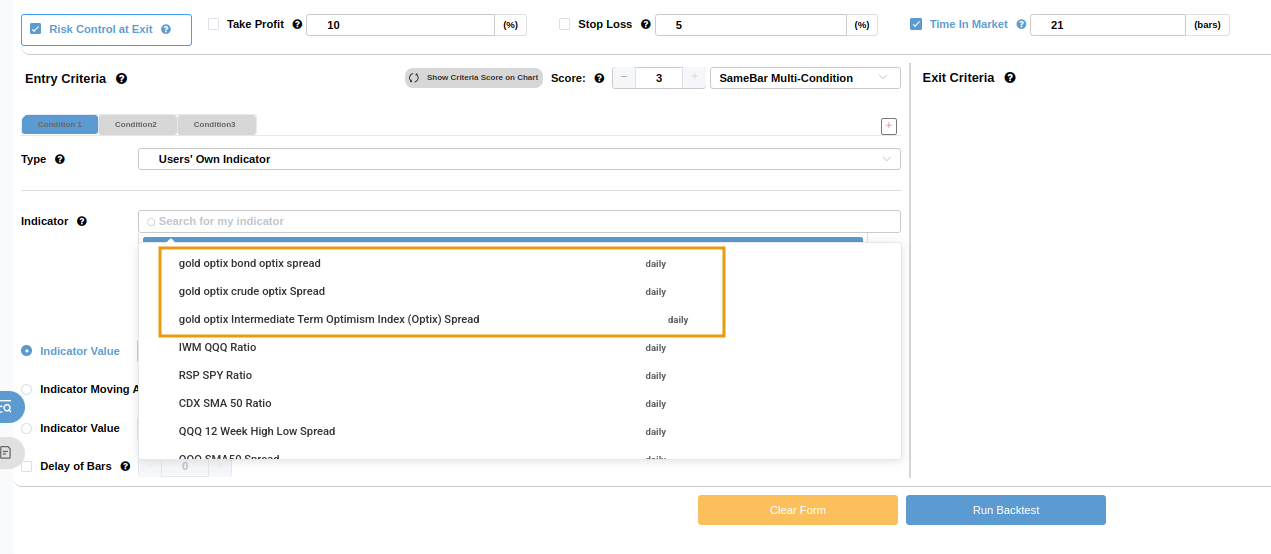
Select the three indicators you just created in Condition 1, Condition 2, and Condition 3 respectively.

What the Research Tells Us...
Gold is currently in a bullish phase, and investors have taken note. Market sentiment remains elevated. Historically, such conditions have not posed significant resistance to gold prices, as they typically occur during the early and mid-stages of sustained, substantial price rallies.
Not only gold, but historical performance in crude oil and gold mining stocks also suggests capital is seeking safe havens. While short-term crowding may cause price volatility, this is not a valid sell signal but rather a warning sign that holding physical assets may currently offer a higher probability of success than purely holding financial assets.