Products
SentimenTrader Trading Tools
‍
Backtest Engine
My Trading Toolkit
Correlation Analysis
Seasonality
Market Prediction
Indicators & Data API
‍
Proprietary Indicators & Charts
Market Data API
Strategies & Scanner
‍
50+ Trading Strategies
Smart Stock Scanner
Smart Option Scanner
Research Reports
‍
Research Solutions
Reports Library
Free Resources
Simple Backtest Calculator
Simple Seasonality Calculator
The Kelly Criterion Calculator
Sentiment Geo Map
Public Research Reports
Education
Sentiment Indicators
Technical Indicators
Pricing
Company
About
In the News
Testimonials
Client Success Stories
Contact
Log inLoginSign up
< BACK TO ALL REPORTS

Investment-grade bonds trigger a breadth thrust buy signal

Dean Christians
2022-05-31
A 10-day ratio of advancing versus declining issues for investment-grade bonds surged in favor of advancing issues, triggering a new breadth thrust buy signal with an 87%-win rate.

 Key points:

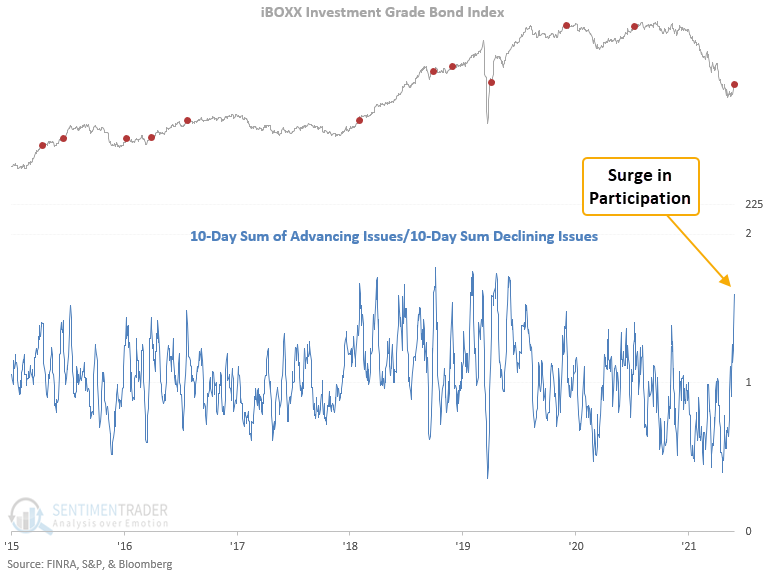
  • A ratio between investment-grade bond advancing and declining issues surged higher
  • The burst in participation triggered a new breadth thrust buy signal on Friday
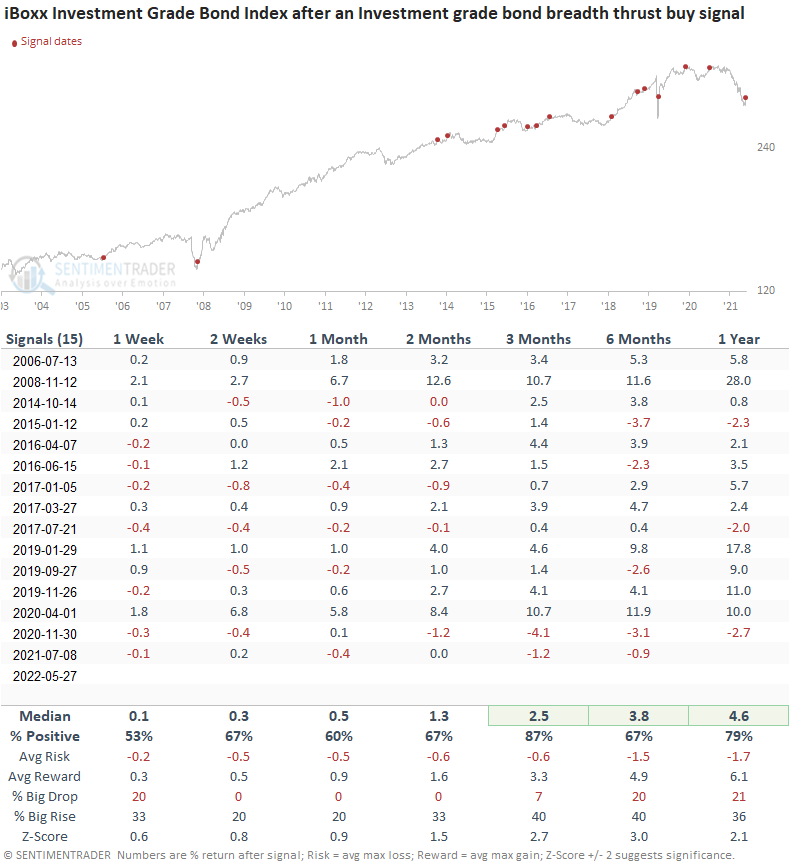
  • Investment-grade bonds have rallied 87% of the time after other signals
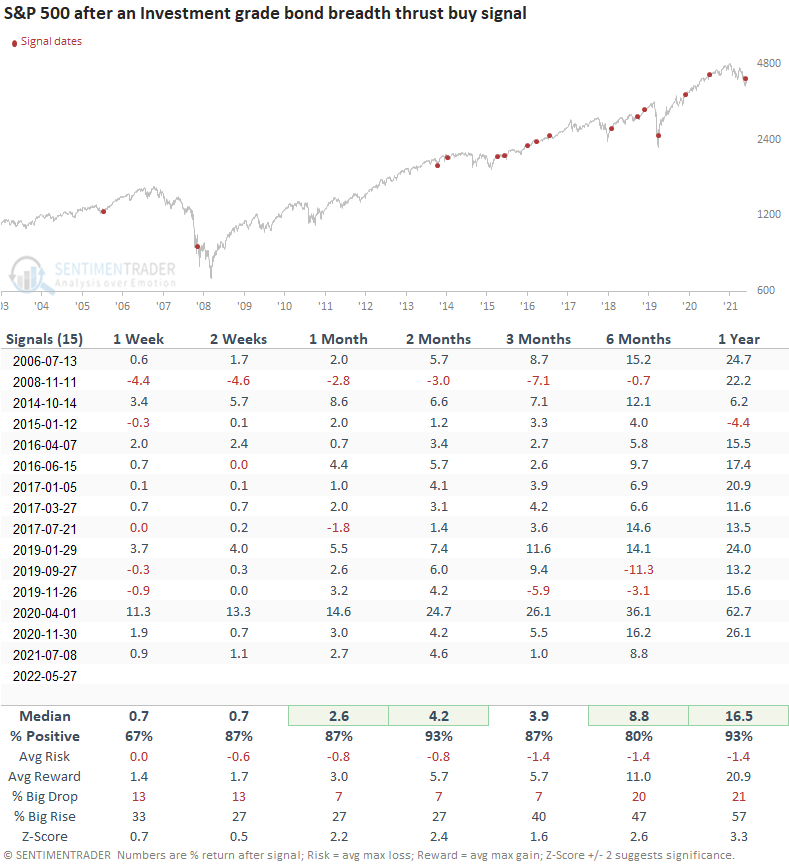
  • Stocks have rallied 93% of the time after other signals

Investment-grade bond advancing issues are outpacing declining issues

The breadth thrust model identifies when the 10-day sum of investment-grade advancing issues exceeds the 10-day sum of investment-grade declining issues by a ratio of 1.41. I use a reset condition to screen out repeats, which requires the ratio to fall below 0.81 before a new signal can trigger again. Please click here to see the previous alert from July 2021.

The IG bond breadth ratio has reached the highest level in almost 2 years.


Similar surges in participation preceded gains 87% of the time

This model generated a signal 15 other times over the past 16 years. After the others, investment-grade bond future returns, win rates, and risk/reward profiles were solid across almost all timeframes. The signal shows a positive return at some point in the first 3 months in all instances. The FINRA bond data started in 2005. So, we need to be mindful that inflation and Fed policy are unlike anything we've seen in the data's history. Interestingly, the 2008 signal never showed a loss even though stock indexes continued to decline for an additional 4 months.

What happens when I apply the signals to the S&P 500

The S&P 500 shows excellent results across all time frames. The IG breadth thrust signal is a TCTM new bull market composite member. While the 2008 alert was early, other instances like 2015, 2018, and 2020 were timelier in identifying an all-clear signal for stocks.

What the research tells us...

When the ratio between investment-grade advancing and declining issues surges in favor of advancing issues, the burst in participation typically leads to more favorable price momentum. Similar setups to what we're seeing now have preceded rising prices for an investment-grade bond index across every time frame, with solid results in the 3-month window. When I apply the signals to the S&P 500, performance looks excellent.

Bonds, like stocks, are off to one of the worst starts to a year in history due to inflation and Fed policy. If you recall, I shared a bullish reversal signal in the Optimism Index for the 20+ year treasury bond ETF (TLT) last week. I would also note that high yield bonds show positive momentum of late. If high yield bonds were to trigger a breadth thrust buy signal, the narrative around the bond market might need to switch from relief rally to cyclical upswing. 

I'm on vacation this week. Research notes will be limited. 

PRODUCTS
SentimenTrader
Trading Tools
Indicators & Data API
‍
Strategies & Scanner
‍
Research Reports
FREE
RESOUrCES
Simple Backtest
Calculator
Simple Seasonality
Calculator
The Kelly Criterion
Calculator
Sentiment Geo Map
‍
Public Research Reports
‍
Education
Sentiment Indicators
‍
Technical Indicators
‍
Pricing
Bundle pricing
‍
FAQ
‍
Announcements
‍
COMPANY
‍
About
‍
In the News
‍
Testimonials
‍
Client Success Stories
CONTACT
‍
General Inquiries
‍
Media Inquiries
‍
Financial Professionals Inquiries
‍
© 2026 Sundial Capital Research Inc. All rights reserved.
Setsail Marketing
TermsPrivacyAffiliate Program
Risk Disclosure: The information and tools provided are for research and analytical purposes only and are not intended as investment advice. Market analysis involves uncertainty, and outcomes may differ from expectations. Users should conduct their own due diligence and consider their individual circumstances before making any financial decisions. Past performance is not necessarily indicative of future results.

Hypothetical Performance Disclosure: Hypothetical performance results have many inherent limitations, some of which are described below. No representation is being made that any account will or is likely to achieve profits or losses similar to those shown; in fact, there are frequently sharp differences between hypothetical performance results and the actual results subsequently achieved by any particular trading program. One of the limitations of hypothetical performance results is that they are generally prepared with the benefit of hindsight. In addition, hypothetical trading does not involve financial risk, and no hypothetical trading record can completely account for the impact of financial risk of actual trading. for example, the ability to withstand losses or to adhere to a particular trading program in spite of trading losses are material points which can also adversely affect actual trading results. There are numerous other factors related to the markets in general or to the implementation of any specific trading program which cannot be fully accounted for in the preparation of hypothetical performance results and all which can adversely affect trading results.

Testimonial Disclosure: Testimonials appearing on this website may not be representative of other clients or customers and is not a guarantee of future performance or success.