Products
SentimenTrader Trading Tools
‍
Backtest Engine
My Trading Toolkit
Correlation Analysis
Seasonality
Market Prediction
Indicators & Data API
‍
Proprietary Indicators & Charts
Market Data API
Strategies & Scanner
‍
50+ Trading Strategies
Smart Stock Scanner
Smart Option Scanner
Research Reports
‍
Research Solutions
Reports Library
Free Resources
Simple Backtest Calculator
Simple Seasonality Calculator
The Kelly Criterion Calculator
Sentiment Geo Map
Public Research Reports
Education
Sentiment Indicators
Technical Indicators
Pricing
Company
About
In the News
Testimonials
Client Success Stories
Contact
Log inLoginSign up
< BACK TO ALL REPORTS

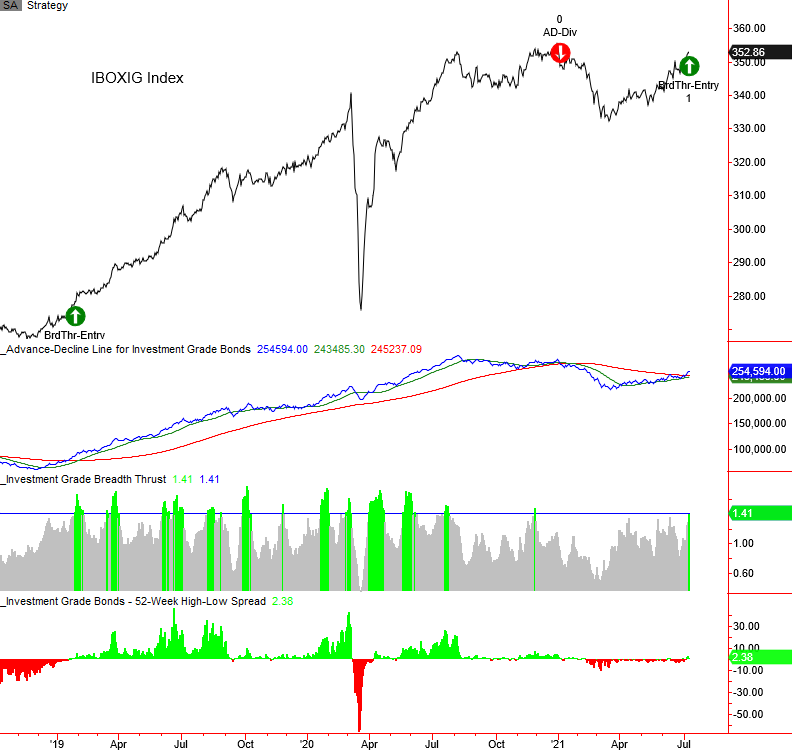
Investment Grade Bond Thrust Signal

Dean Christians
2021-07-09
Investment-grade bonds registered a new breadth thrust buy signal at the close of trading on 7/8/21. Let's review the forward return outlook for bonds and stocks.

Investment-grade bonds registered a new breadth thrust buy signal at the close of trading on 7/8/21. The new signal now flips my investment-grade timing model to the long side after having been on the sidelines since January. In a nutshell, the corporate bond timing model uses market breadth data from FINRA TRACE to identify trend changes in advance of price action alone. For more details on the timing model concept and signal components, click here.

The new investment-grade breadth thrust signal also provides us with an important message for stocks. The algorithm is a component in the TCTM Composite Master New Bull Market Model as the forward returns for stocks are very healthy when a signal is generated. 

BREADTH THRUST SIGNAL CONCEPT

The breadth thrust signal that I use for all my models is calculated as follows.

  1. Sum the advancing issues for the last ten days.
  2. Sum the declining issues for the last ten days.
  3. Calculate the ratio between the two totals. 
  4. When the ratio crosses above a user-defined threshold, buy.
  5. A reset condition is utilized whereby the ratio must cross back below a user-defined threshold before a new signal can occur.

Walter Deemer, a market strategist, calls it breakaway momentum.

Let's review the investment-grade timing model and assess the forward return outlook for bonds and stocks when a breadth thrust signal occurs.

CURRENT DAY CHART FOR INVESTMENT-GRADE TIMING MODEL

The investment-grade bond timing model is more sensitive to movements in treasury yields, whereas high-yield bonds will be more sensitive to economic/credit conditions. The recent decline in yields is playing a role in the new signal.

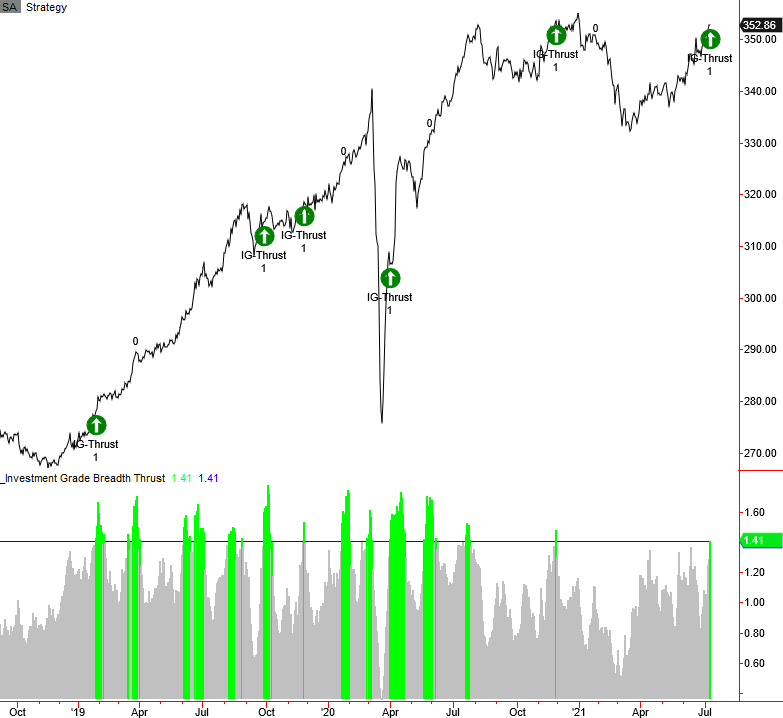
Let's now look at the breadth thrust model as a standalone signal for investment-grade bonds.

CURRENT DAY CHART

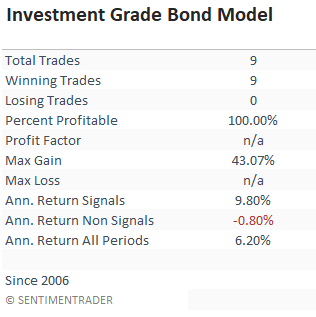
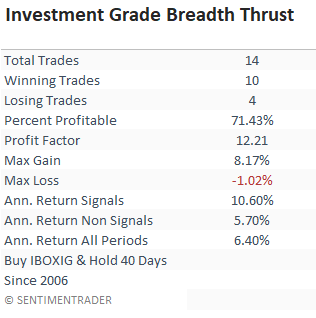
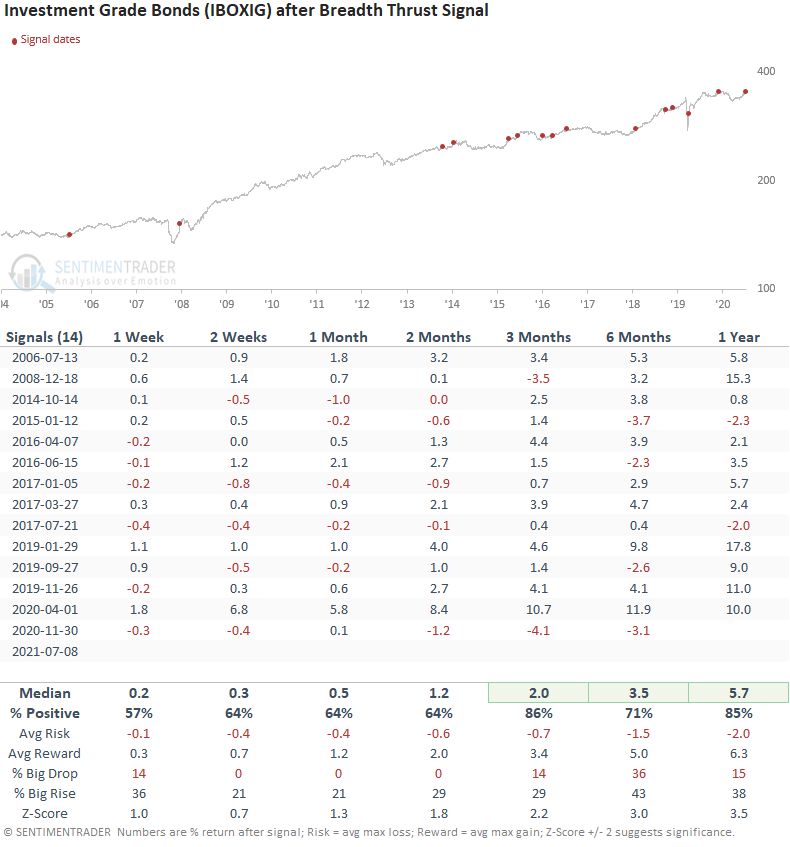
The trading statistics in the table below reflect the optimal days-in-trade holding period of 40 days. When I run optimizations for trading signals, I cap the max number of days at 42.

HOW THE SIGNALS PERFORMED - INVESTMENT GRADE

Performance looks solid across all timeframes, especially in the 3-12 month window.

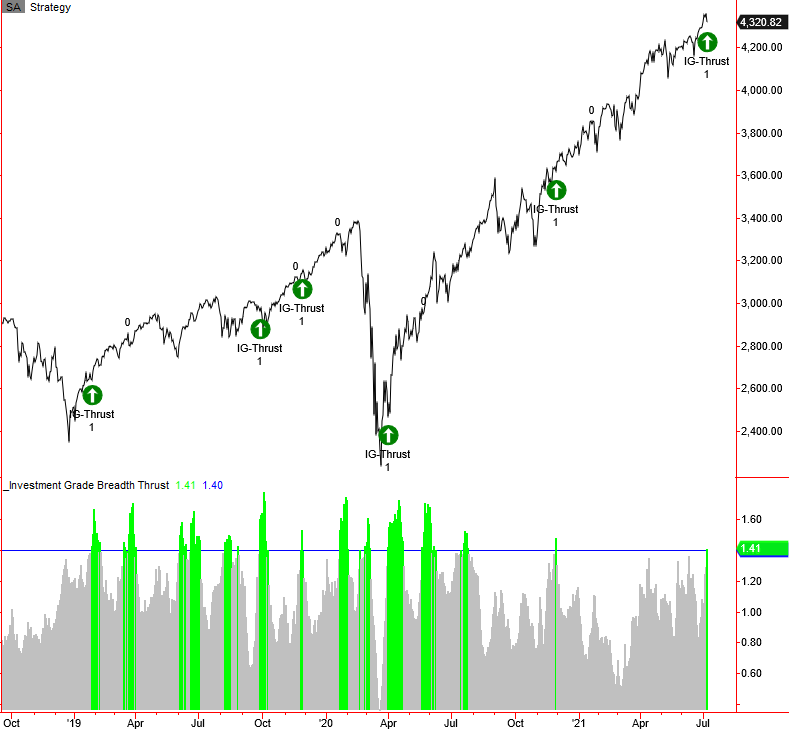
Let's assess the forward return outlook for the S&P 500 by applying the investment-grade breadth thrust signals to the index.

CURRENT DAY CHART

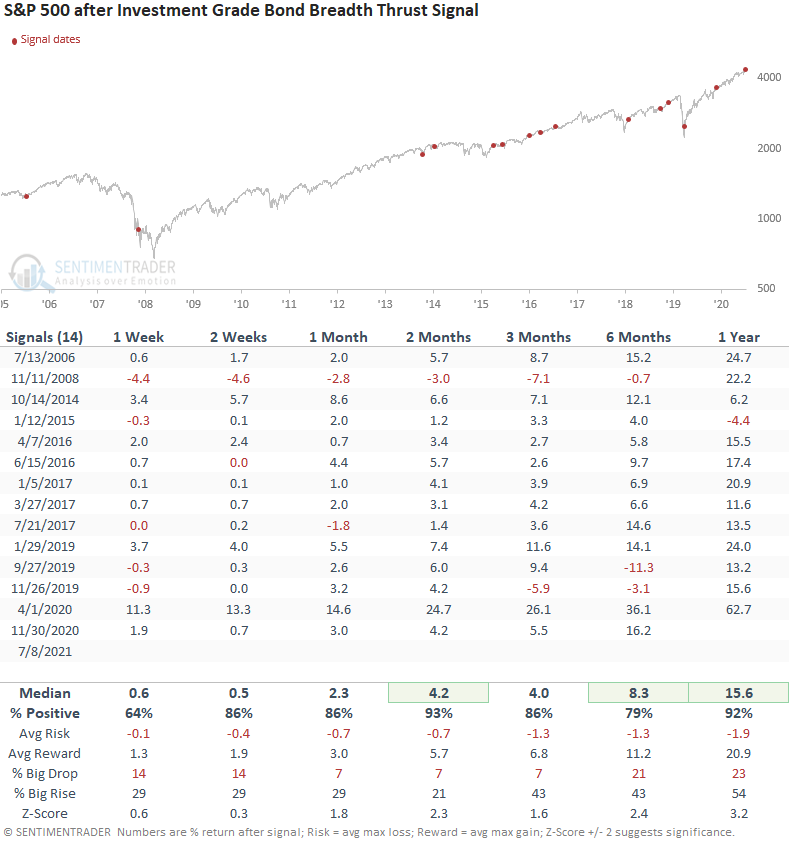
The trading statistics in the table below reflect the optimal days-in-trade holding period of 36 days. When I run optimizations for trading signals, I cap the max number of days at 42.

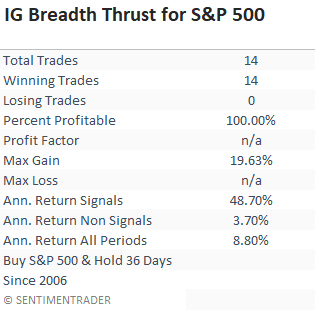
HOW THE SIGNALS PERFORMED -S&P 500

The returns look solid across all timeframes with several notable z-scores.

While I'm a big fan of the market breadth data for bonds and the message it can provide as it relates to the economy, credit conditions, and the stock market, we have to keep in mind that the data history is limited. Therefore, the sample size is small.

PRODUCTS
SentimenTrader
Trading Tools
Indicators & Data API
‍
Strategies & Scanner
‍
Research Reports
FREE
RESOUrCES
Simple Backtest
Calculator
Simple Seasonality
Calculator
The Kelly Criterion
Calculator
Sentiment Geo Map
‍
Public Research Reports
‍
Education
Sentiment Indicators
‍
Technical Indicators
‍
Pricing
Bundle pricing
‍
FAQ
‍
Announcements
‍
COMPANY
‍
About
‍
In the News
‍
Testimonials
‍
Client Success Stories
CONTACT
‍
General Inquiries
‍
Media Inquiries
‍
Financial Professionals Inquiries
‍
© 2026 Sundial Capital Research Inc. All rights reserved.
Setsail Marketing
TermsPrivacyAffiliate Program
Risk Disclosure: The information and tools provided are for research and analytical purposes only and are not intended as investment advice. Market analysis involves uncertainty, and outcomes may differ from expectations. Users should conduct their own due diligence and consider their individual circumstances before making any financial decisions. Past performance is not necessarily indicative of future results.

Hypothetical Performance Disclosure: Hypothetical performance results have many inherent limitations, some of which are described below. No representation is being made that any account will or is likely to achieve profits or losses similar to those shown; in fact, there are frequently sharp differences between hypothetical performance results and the actual results subsequently achieved by any particular trading program. One of the limitations of hypothetical performance results is that they are generally prepared with the benefit of hindsight. In addition, hypothetical trading does not involve financial risk, and no hypothetical trading record can completely account for the impact of financial risk of actual trading. for example, the ability to withstand losses or to adhere to a particular trading program in spite of trading losses are material points which can also adversely affect actual trading results. There are numerous other factors related to the markets in general or to the implementation of any specific trading program which cannot be fully accounted for in the preparation of hypothetical performance results and all which can adversely affect trading results.

Testimonial Disclosure: Testimonials appearing on this website may not be representative of other clients or customers and is not a guarantee of future performance or success.