
Introducing the JK Seasonal Bond Calendar

Key points:
- Many investors are quite familiar with the election cycle in the stock market, but few are aware that treasury bonds also exhibit cyclical behavior across the four-year cycle
- Also, treasuries have performed much differently over the years on specific trading days of the month versus all other days
- This piece puts the bond Election Cycle Months (ECM) and Trading Days of Month (TDM) cycles together and introduces the JK Seasonal Bond Calendar
The JK Seasonal Bond Calendar
The model detailed below is designed to suggest the trend for long-term treasury bond futures based on two seasonal factors. That said, non-futures traders may consider applying it to standard treasury bond ETFs such as ticker TLT. More aggressive traders may also consider leveraged and/or inverse bond ETFs.
While the "strategy" is presented here in the form of a mechanical trading system, it is not necessarily my recommendation that it be used mechanically. As noted several times throughout, the back-tested results shown below do not account for slippage or commissions, and therefore undoubtedly overstate what a trader can expect in terms of real-world trading returns.
Ultimately, the goal is to use the model as a filter to help traders decide when to play the long or short side of the treasury bond market, or whether to stand aside.
One other thing to note: As this piece is written, the calendar model described here is not presently available in the software. I have chosen to write about it now because the model itself is bearish as of January 2nd, 2026. I will be working with our programming team shortly to have the full model added to the software for those who wish to follow it. The status of the model during the first quarter of 2026 is detailed below.
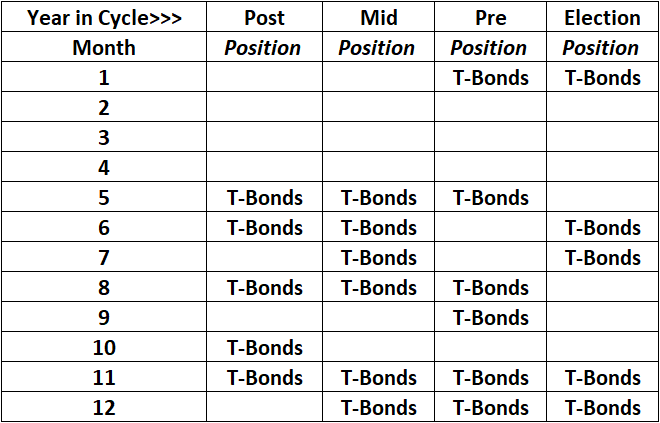
Part 1: The Bond Market Election Cycle Calendar
The four-year election cycle in the stock market has been extensively studied and reported on. However, most investors and traders are unaware that the bond market has also exhibited certain specific tendencies across the 48-month election cycle. The table below highlights the months that tend to show better bond performance compared to all other months. The theory is that a trader would hold a long position in bonds during the months highlighted in the table below as "T-Bonds" and would be flat, or potentially short bonds, during the blank months.
For testing, we will specifically examine holding a long or short position in 30-year Treasury bond futures. For futures contracts, each one full point of price movement represents a change of $1,000 in contract value. If you are long, each one-point rise in price represents a gain of $1,000, and each one-point decline in price represents a loss of $1,000. If you are short, each one-point decline in price represents a gain of $1,000, and each one-point rise represents a loss of $1,000.
Non-futures traders can consider buying shares of the iShares 20+ Year Treasury Bond ETF (ticker TLT).
A closer look at Election Cycle Months (ECM)
The table below highlights the "favorable" months for t-bonds during the four-year election cycle.
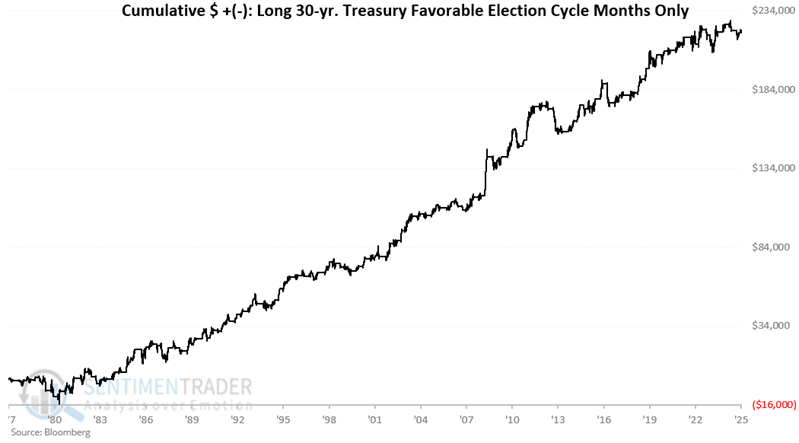
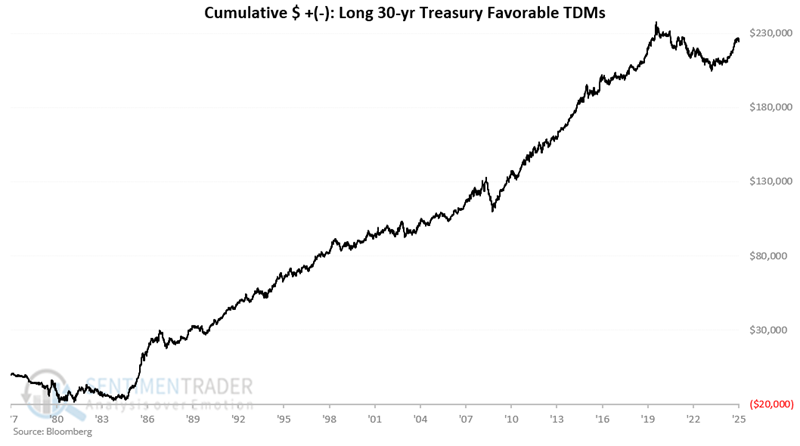
The chart below displays the hypothetical cumulative $ gain/loss achieved by holding a long position in 30-year t-bond futures only during the months listed in the table above, starting in 1977. From August 1977 through December 30th, 2025, the hypothetical gain was +$222,032 (IMPORTANT: Please keep in mind that all results are hypothetical and do not include any deductions for slippage or commissions. This is true for all results that follow).
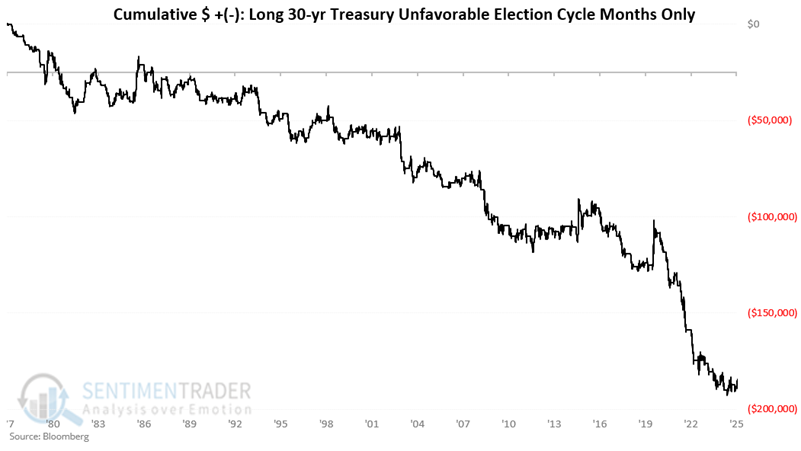
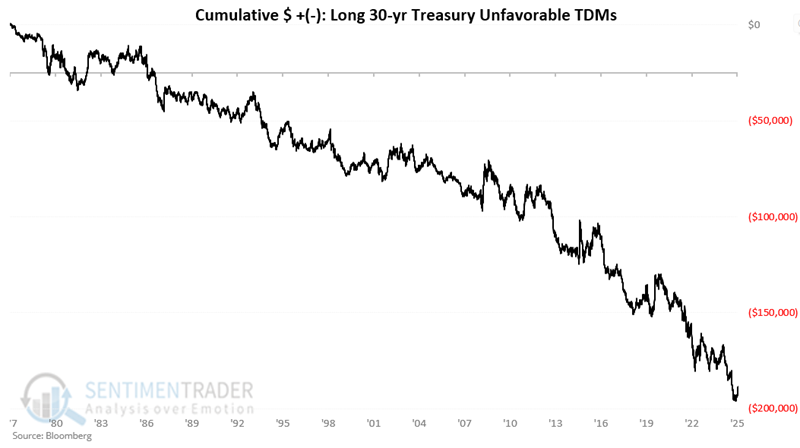
Now let's look at "all other months," i.e., the months that are blank in the table above. The chart below displays the hypothetical cumulative gain/loss achieved by holding a long position in 30-year T-bond futures only during the months left blank in the table above, starting in 1977. From August 1977 through December 30th, 2025, the hypothetical loss was -$185,595.
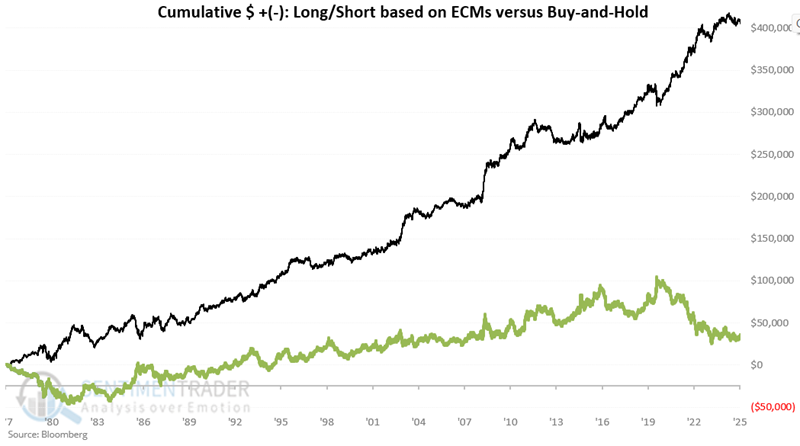
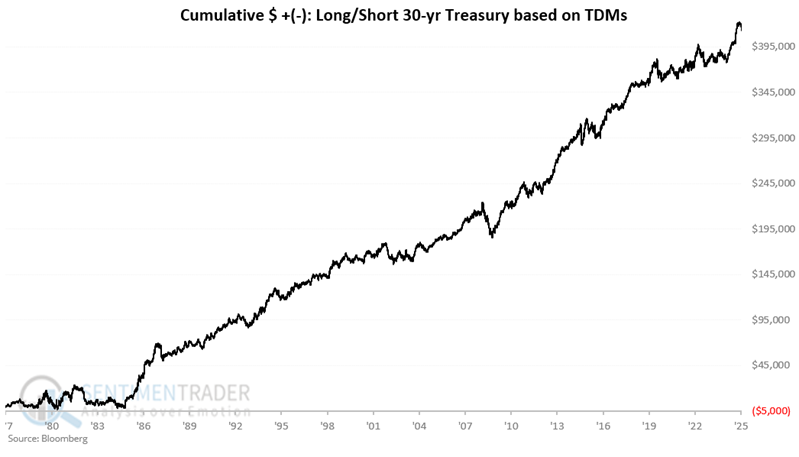
Next, let's combine the two, assuming we hold a long position during the 22 favorable months and a short position during the 26 other months. The hypothetical cumulative gain is +$410,628.
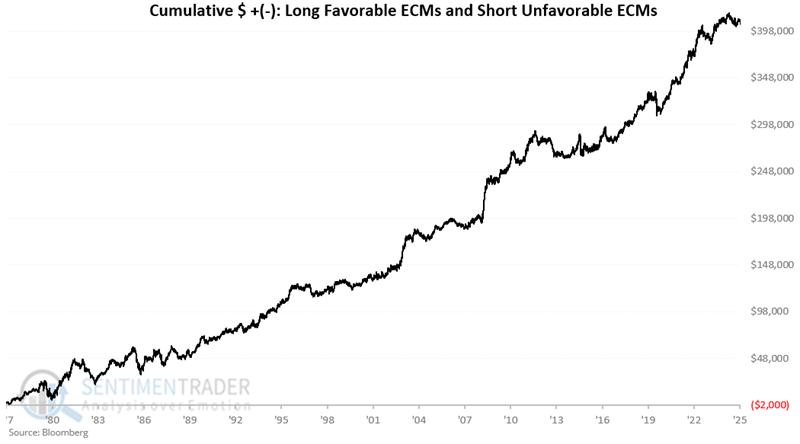
For comparison, the following chart displays the results from the "long favorable months/short unfavorable months" chart above. It includes the hypothetical result of buying and holding a long position in T-bond futures (represented by the green line). Reminder: Results are based solely on daily price change data and not on any real-world trading. The hypothetical buy-and-hold gain was +$33,437.
Now, let's look at trading days of the month.
Part 2: A Look at Trading Days of the Month (TDM) in T-bonds
For this model, a) the 10th, 11th, and 12th trading days of the month (not calendar days), plus b) the last five trading days of the month, are considered "favorable."
These same rules are applied every month.
The chart below displays the hypothetical cumulative gain/loss achieved by holding a long position in 30-year T-bond futures only during the "favorable" days listed above every month, starting in 1977. From August 1977 through December 30th, 2025, the hypothetical gain was +$225,205.
Note that during the severe bond bear markets in the late 1970s/early 1980s and again after the 2020 peak in bond prices, significant drawdowns occurred.
Conversely, the chart below displays the hypothetical cumulative $ gain/loss from holding a long position in t-bonds futures during "all other days" of the month (i.e., NOT trading days of months 10, 11, 12, nor during the last five trading days of the month, each month) since August 1977. The hypothetical cumulative result is a loss of -$191,768.
Next, let's combine the two, assuming we hold a long position during the "favorable" days every month and a short position on all other days. The hypothetical cumulative gain is +$416,974.
Combining ECM and TDM to create the JK Seasonal Bond Model
We will create the model as follows:
A = If ECM is favorable +1 else 0
B = If TDM is favorable +1 else 0
JK Seasonal Bond Model = A + B
Obviously, for any given day, the model can read +2, +1, or 0. Let's review the T-bond futures performance for each reading level.
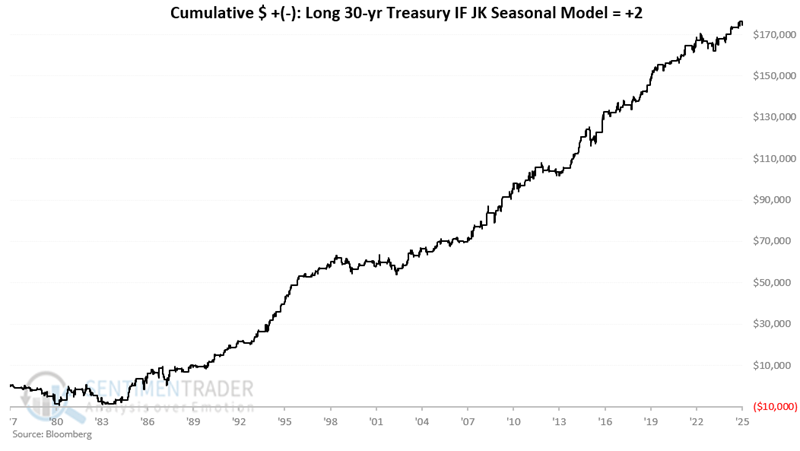
If the Model = +2
The chart below displays the hypothetical cumulative gain/loss achieved by holding a long position in 30-year T-bond futures only for those days when the model indicates a reading of +2. From August 1977 through December 30th, 2025, the hypothetical gain was +$174,803.
If the Model = +1
The chart below displays the hypothetical cumulative gain/loss achieved by holding a long position in 30-year T-bond futures only for those days when the model indicates a +1 reading. From August 1977 through December 30th, 2025, the hypothetical gain was +$97,632.
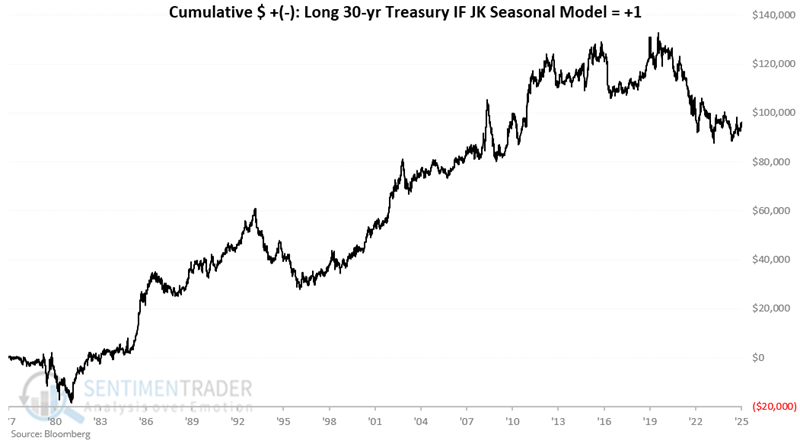
The good news is that the net result was a significant gain. However, a closer look at the chart above reveals several large drawdowns along the way.
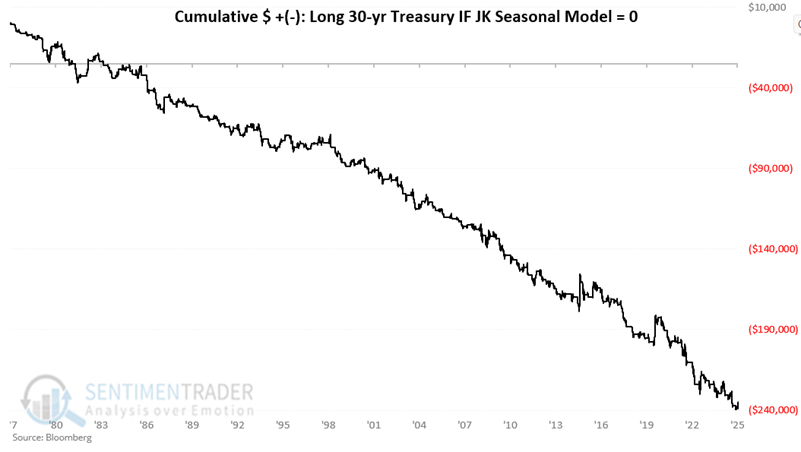
If the Model = 0
The chart below displays the hypothetical cumulative gain/loss achieved by holding a long position in 30-year T-bond futures only for those days when the model indicates 0. From August 1977 through December 30th, 2025, the hypothetical loss was -$238,998.
Creating a hypothetical systematic approach
The purpose of the JK Seasonal Bond Model is merely to suggest the direction that a trader should be looking to trade on any given day. While the model could, in theory, be used as a standalone trading model, no one is advising that it be used in a mechanical way. Please note that all results shown do not account for slippage, commissions, late fills, and other factors.
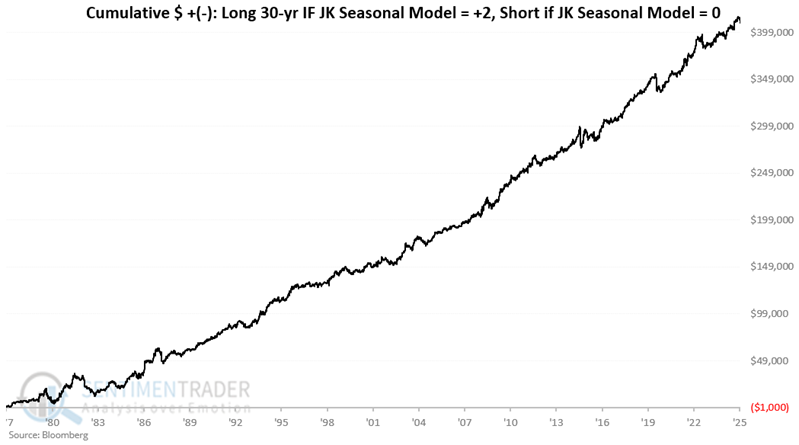
Still, the chart below displays the hypothetical $ gain/loss achieved by holding:
- A long position when the model reads +2
- No position when the model reads 0
- A short position when the model reads +1
The table below shows the hypothetical annual $ gain/loss from trading mechanically using the rules above.
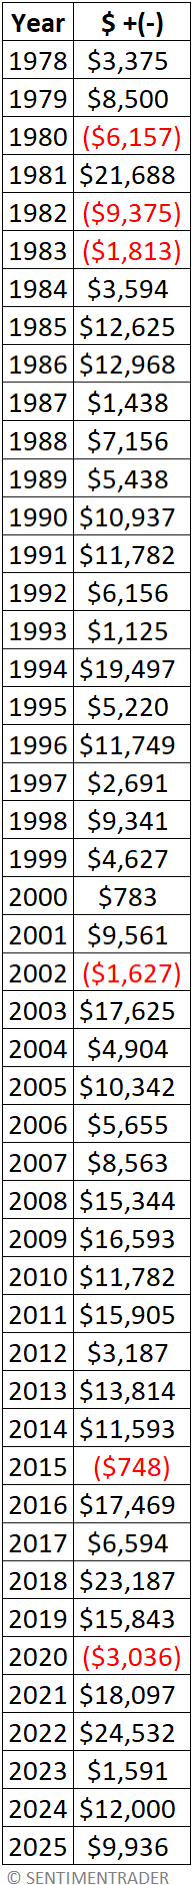
The table below summarizes annual results.
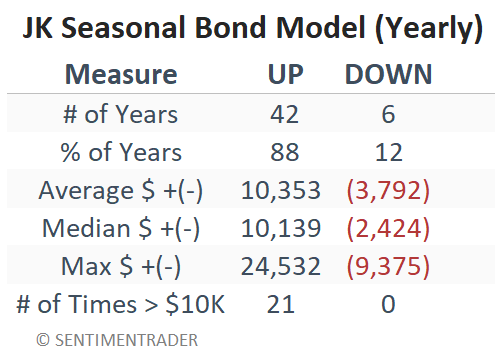
While the hypothetical summaries are quite promising, remember that real-world trading is a different animal. The chart below displays the maximum drawdowns from each equity peak along the way. Note that there have been three separate drawdowns in excess of $20,000 and six separate drawdowns in excess of $15,000.
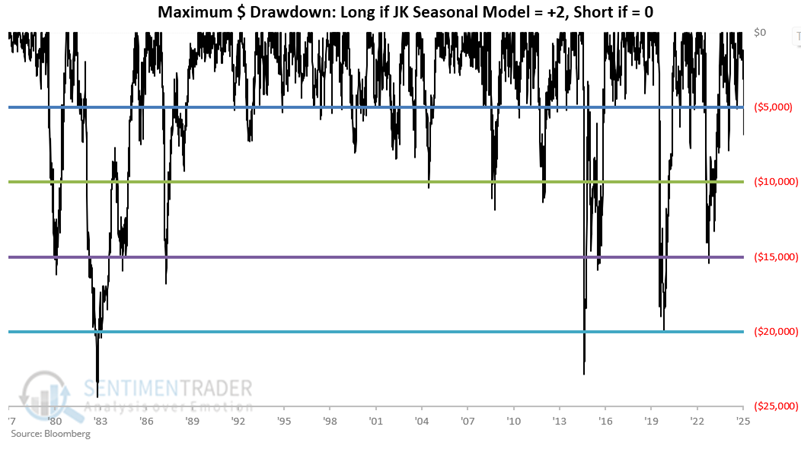
Traders who cannot handle this type of volatility, either financially or emotionally, may consider trading ETFs instead. Traders are also encouraged to use this model to confirm or deny their own preferred trading setup for bonds.
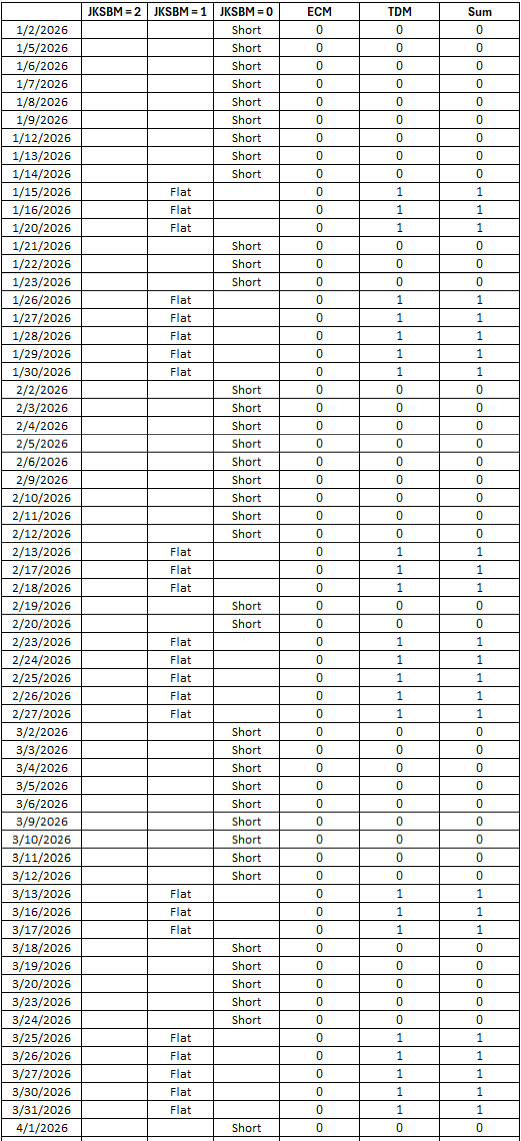
The Calendar for Q1 2026
As I mentioned at the outset, I will be working with our programming team to add this model to our website shortly. In the meantime, the calendar for the first quarter of 2026 appears below.
What the research tells us…
Seasonality is a tool that I use to help me decide "when to look where" and "in which direction to be looking." It should rarely be used in a standalone fashion. The model detailed here is likely no exception. The results shown here, based solely on the day appearing on the calendar, are compelling and suggest that traders can gain an edge by looking to trade the long side when the model is favorable and looking to play the short side when the model is unfavorable. Nevertheless, trading reality suggests the need for user input to confirm the trend, responsibly allocate capital, and ruthlessly limit risk.