
Introducing the JK Economic Barometer - Part II

Key points:
- The stock market is a leading indicator for the economy; that said, what's good for the economy is generally good for stocks
- In Part I, we detailed the JK Economic Barometer, which combines the Macro Index Model and our LEISUM indicator into a tool to identify times when economic contraction is most likely occurring
- Here in Part II, we will examine several ways to use the JK Economic Barometer as a stock market tool
A quick review of the JK Economic Barometer
After the Macro Index Model is updated each month (typically on the first trading day of the month), we combine the Macro Index Model and the LEISum indicator to create a single indicator known as the JK Economic Barometer. The components are:
A = Macro Index Model (can range from 0.00 to 1.00)
B = LEISUM
C = B + 1 (done to avoid a reading of 0; B can range from 1 to 4)
D = A * C
JK Economic Barometer = D
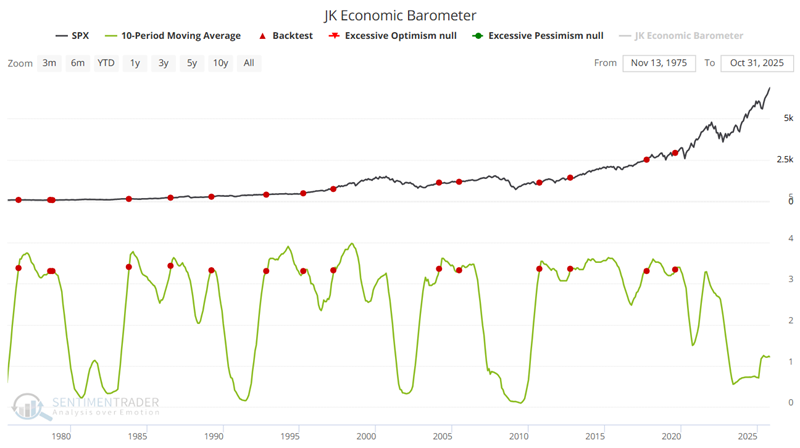
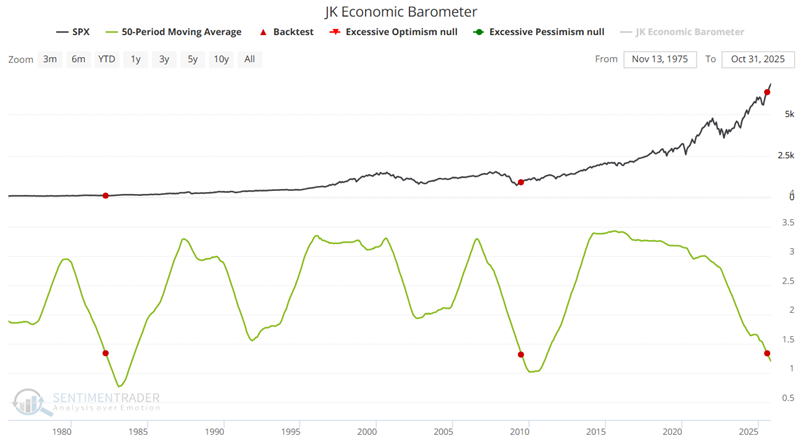
The chart below displays the reading for the JK Economic Barometer as of the first trading day of each month since mid-1968. Also note that a horizontal line marks the 0.30 level. The index is currently towards the low end of the range at 0.55.
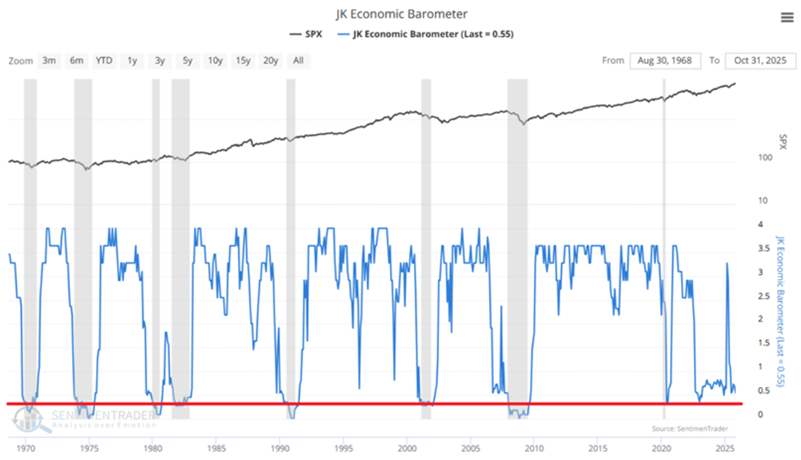
Note that, although it has been towards the low end of the historical range in recent years, the indicator has not been below the critical 0.30 level since 2009. Let's examine economic performance relative to the indicator.
NOTE: The Conference Board Leading Economic Indicator index value has not been updated for several months due to the government shutdown. For our purposes, we have continued to use the most recently reported value as Variable B.
Performance of the S&P 500 after an indicator reversal from a low level
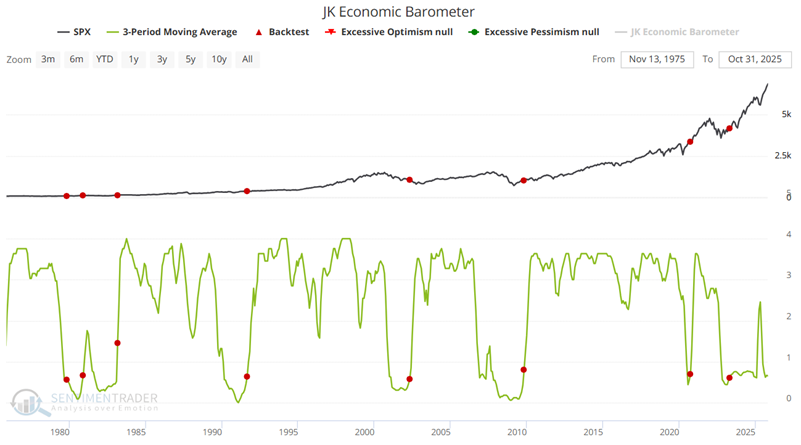
There are two circumstances when the JK Economic Barometer may provide useful signals for stock market investors. The first scenario involves the indicator coming off a low level - i.e., after an actual recession or at least a significant economic downturn.
The chart below highlights instances when the 3-month moving average for the JK Economic Barometer crossed above 0.55.
The table below displays the S&P 500 signal-by-signal performance following the signals highlighted above, summarizing performance across various timeframes.
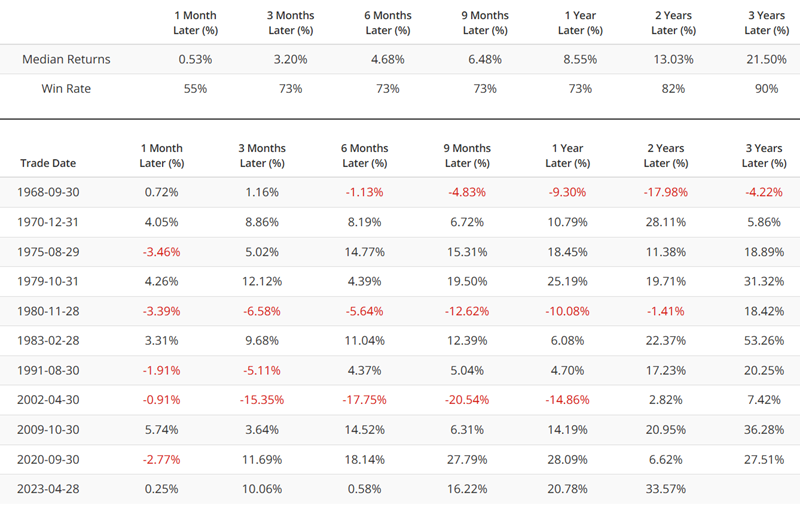
Note that overall results are decent, but not spectacular.
Performance of the S&P 500 after indicator marks strong economic conditions
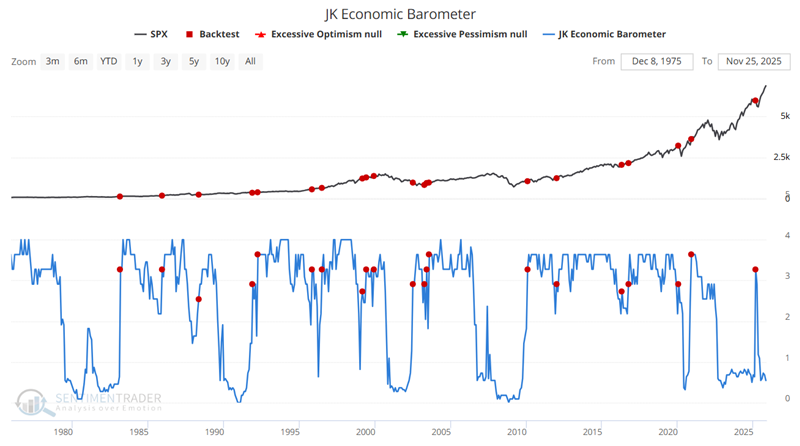
The second and third scenarios involve occasions when the indicator highlights a period of strong economic conditions. The chart below highlights all months when the JK Economic Barometer crossed above 2.5, including overlapping signals.
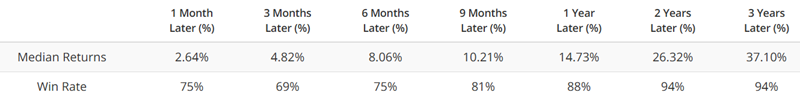
The table below displays S&P 500 signal-by-signal performance following the signals highlighted above.
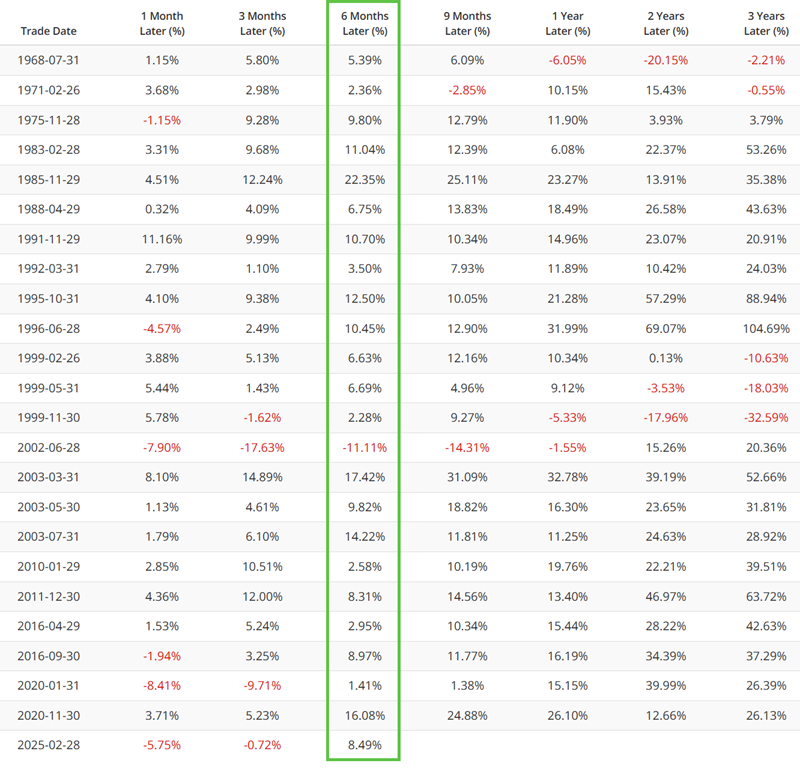
The table below summarizes S&P 500 performance following the signal dates highlighted above.
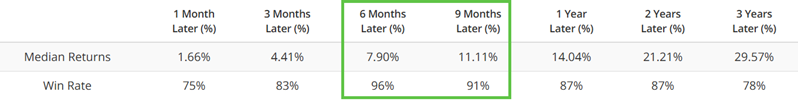
The high Win Rates for six and nine months after a signal suggest good reliability.
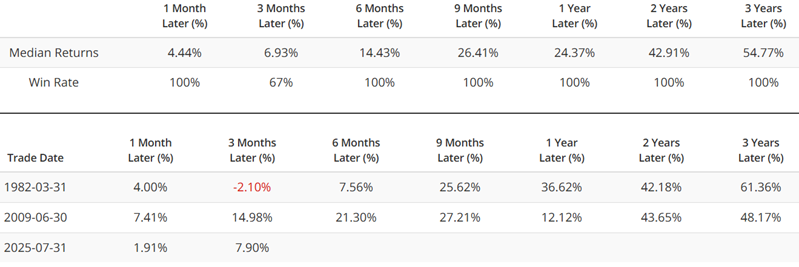
Since there does not appear to be "one best way" to use the JK Economic Barometer as a stock market indicator, let's take a look at a longer-term version of this indicator. The chart below highlights all dates when the 10-month moving average of monthly JK Economic Barometer readings crossed above 3.3.
The table below displays the S&P 500 signal-by-signal performance following the signals highlighted above.
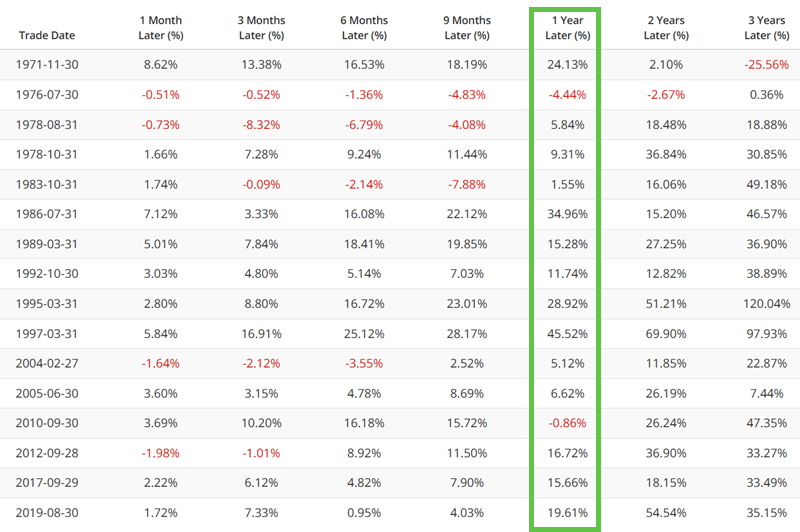
The table below summarizes S&P 500 performance following the signals highlighted above.
Results are solid, albeit not perfect, across the board.
One more rare extreme, for what it's worth
Let's consider one more iteration that may or may not prove meaningful in the long run. For this test, we use a 50-month-long moving average. The chart below highlights the infrequent occasions when this average crossed below 1.35.
The sample size is minuscule, so it is impossible to draw any conclusions. That said, if we set aside that fact for a moment, the results so far are compelling.
What the research tells us…
That the performance of the economy and the stock market is intertwined is undeniable. The stock market has long demonstrated an uncanny ability to anticipate changes in the economy's trend, before both upside and downside economic reversals. This is why relying solely on economic indicators to assess the stock market is problematic. Just as the economy seems to be swirling into the abyss, the stock market will anticipate the bottom in the economy and reverse sharply higher - typically six to nine months in advance of the actual economic bottom - and leave "economy-focused" bears in the dust. Likewise, during the late stages of an economic boom, the stock market tends to move sideways for a period before beginning to trend lower in anticipation of an impending economic slowdown.
The signals detailed above are not intended as standalone investment trading strategies that should be relied upon to decide whether to be 100% in or out of the stock market. Their primary purpose is to help investors stay in tune with the primary trend of the stock market by identifying when a) the economy is about to turn for the better, and/or b) when a solid economic boom is undergirding an ongoing bull market.