
Introducing the JK Economic Barometer

Key points:
- Too many forget that the stock market is a leading indicator of the economy and not vice versa
- That said, an actual recession can have devastating effects for businesses and individuals across all walks of life
- In this piece, we combine our Macro Index Model and LEISUM indicators into a single tool to identify times when economic contraction is most likely occurring
Two models for gauging the state of the economy
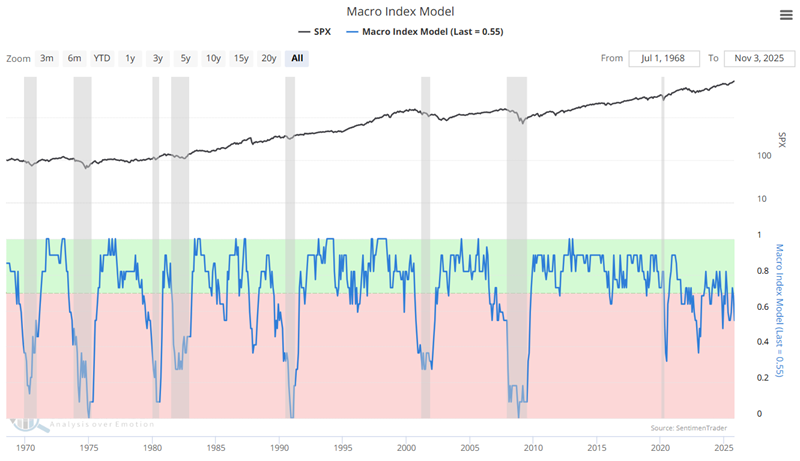
We utilize two primary models to gauge the current trend and potential future trend of the economy - the Macro Index Model and the LEISum indicator. The Macro Index Model comprises eleven economic indicators to form an overall index that ranges from 0.00 to 1.00. Generally speaking, a reading above 0.70 is considered favorable for the economy and the stock market, and vice versa. The Macro Index Model is typically updated on the first trading day of each month.
The chart below displays the history of the Macro Index Model versus the S&P 500 index. Periods of economic recession are highlighted in grey. The latest reading as of November 3rd, 2025, is 0.55.
The LEISum indicator examines specific trends in the Conference Board Leading Economic Indicators data series and can range from 0 to 3. Any reading above zero is considered favorable for the economy and the stock market.
The chart below displays the history of the LEISum versus the S&P 500 index. Periods of economic recession are highlighted in grey. The latest reading for LEISum is 0.
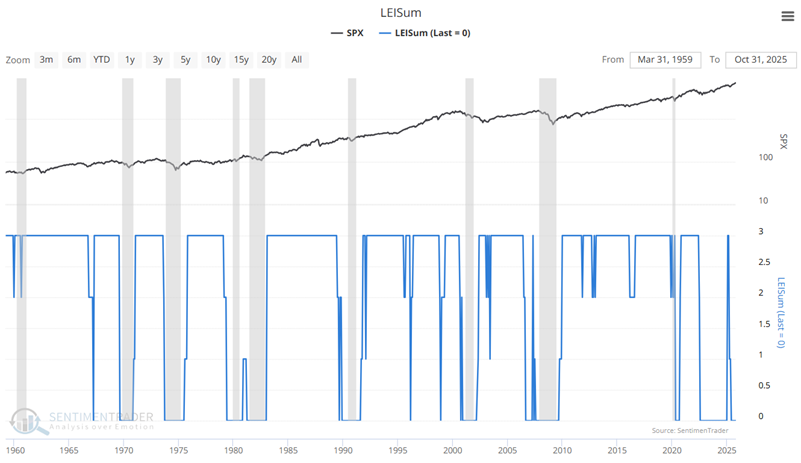
Please note that LEI values are typically released near the end of the month. For our purposes, the latest values are evaluated only at the end of each month. Note also that the value was not updated in October due to the government shutdown, so we carried the previous month's value forward to the latest month.
Note that in the past, low readings for both indicators above have typically coincided with economic recessions. However, in the last five years, both have spent time at low levels, but (so far) there has been no recession. So do these models no longer work as effectively? Not necessarily. Perhaps we just need to take a closer look at how they interact with each other.
Next, let's combine these two models into a new indicator, which I call the JK Economic Barometer.
Combining the Macro Index Model and LEISUM to get the JK Economic Barometer
After the Macro Index Model is updated each month (typically on the first trading day of the month), we will combine the two models into one indicator. It's pretty simple. We add one to LEISUM and multiply that value by the latest value for the Macro Index Model to arrive at the JK Economic Barometer. The components are:
A = Macro Index Model (can range from 0.00 to 1.00)
B = LEISUM (can range from 0 to 3)
C = B + 1 (done to avoid a reading of 0; Variable C can range from 1 to 4)
D = (A * C)
JK Economic Barometer = D
It's pretty simple. We add one to LEISUM and multiply that value by the latest value for the Macro Index Model to arrive at the JK Economic Barometer.
The chart below displays the reading for the JK Economic Barometer since mid-1968. Also note that a horizontal red line marks the 0.30 level.
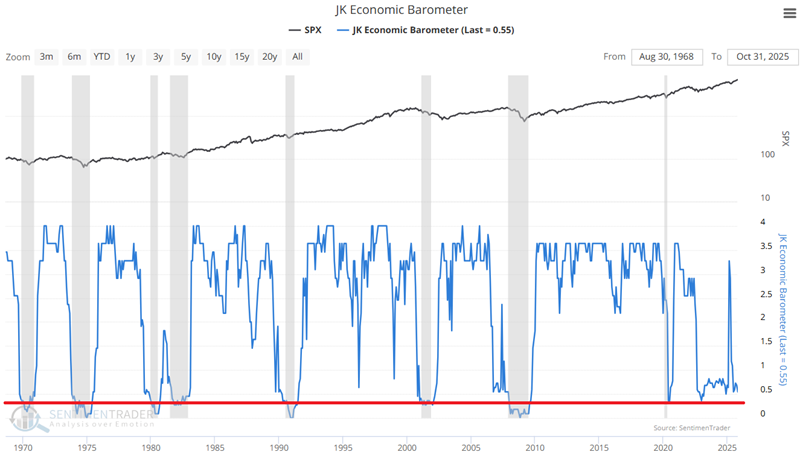
Note that, although it has been towards the low end of the historical range in recent years, the indicator has not been below the critical 0.30 level since 2009. Let's examine economic performance relative to the indicator.
Performance of Coincident Economic Indicators
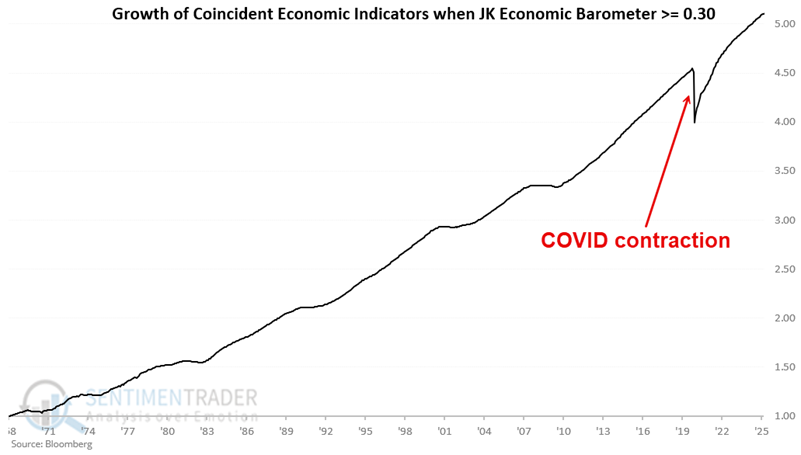
For this test, we start each measure at 1.00 at the end of June 1968. The chart below displays the hypothetical growth of the Coincident Economic Indicators Index only during months when the JK Economic Barometer reading began the month at 0.30 or higher.
Conversely, the chart below displays the hypothetical growth of the Coincident Economic Indicators Index only during months when the JK Economic Barometer reading at the beginning of the month was below 0.30.
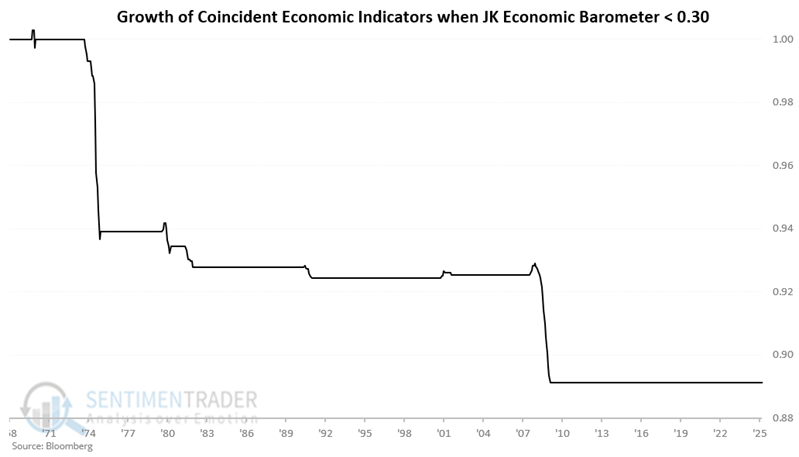
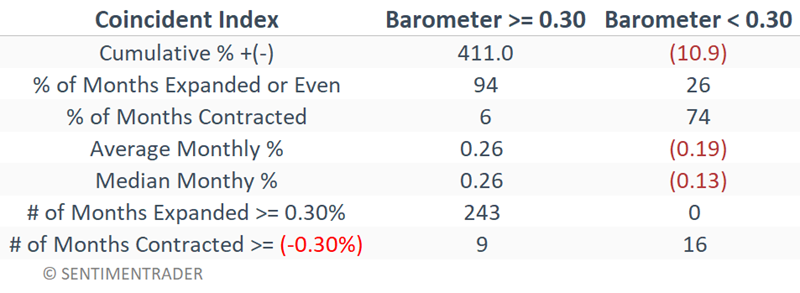
The table below displays a summary of the performance of the Coincident Economic Indicators depending on whether the JK Economic Barometer was above or below 0.30.
What the research tells us…
Our Macro Index Model and LEISum indicator have a long history of providing early warnings of impending and ongoing economic downturns. The latest research suggests that combining the two into a single indicator may help us pinpoint periods of economic contraction. At the moment, the JK Economic Barometer is on the low end of the range at 0.55. So the state of the economy is presently a legitimate concern (though not necessarily a reason to sell stocks in and of itself). A reading below 0.30 would confirm that an actual economic recession is occurring.
In Part II, we will look at stock market performance relative to the JK Economic Barometer.