
Introducing the JK 8-Year Gold Stock Calendar

Key points:
- Gold stocks are a highly volatile asset class and capable of tremendous advances and relentless, devastating declines
- They are also highly cyclical in nature, though not necessarily in obvious ways
- This note introduces my own 8-year seasonal gold stock calendar
Gold miners are highly volatile
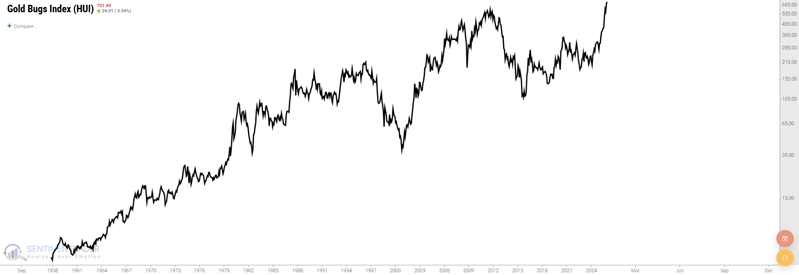
The chart below shows the historical price action of the Gold Bugs Index (ticker: HUI), which tracks gold mining stocks and has a history back to 1957.
It is no surprise that gold mining stocks, as an asset class, are highly correlated with the price of gold bullion. However, over periods of time, gold stocks may significantly outperform or underperform gold bullion. This is evident in the chart below, which shows the price action for ticker HUI and Gold bullion (London PM fix) in the top clip, and the relative performance of HUI versus Gold bullion in the bottom clip.
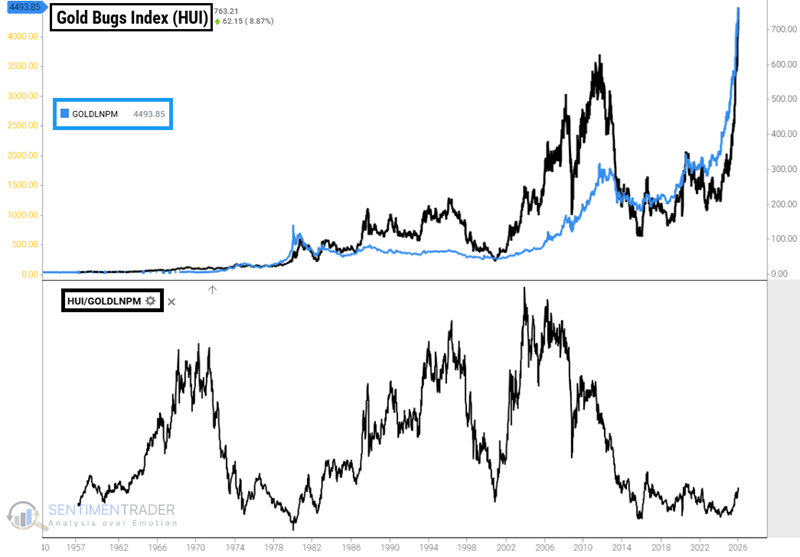
Being in gold stocks at the right time can produce significant, above-average gains. However, it is equally clear that being in gold stocks at the wrong time can lead to devastating losses.
Introducing the JK 8-Year Gold Stock Calendar (JK8YC)
I developed the following calendar over many years, but am writing about it here for the first time. The original goal was to identify seasonal patterns in gold stock price action. While the JK 8-Year Gold Stock Calendar is presented here as a standalone model, it should be emphasized that traders should not trade gold stocks without a risk management plan (e.g., a stop-loss) in place.
- As the name implies, the calendar repeats every eight calendar years, or every 96 months
- The first full 8-year period covered below extends from December 31st, 1964, through December 31st, 1972
- January of 1965 is considered Month #1, and December of 1972 is considered Month #96. The cycle then starts again with January 1973 as Month #1 of the next eight-year cycle
- However, because we have HUI data starting in 1957, we start the test in January 1958, which is technically Month #13 of the eight-year cycle that began in January 1957
In the calendar below, each month is labeled "Bullish," "Bearish," or left blank. In theory, we look for gold stocks to perform well in months labeled "Bullish" and poorly in months labeled "Bearish." No implication is implied for months left blank.
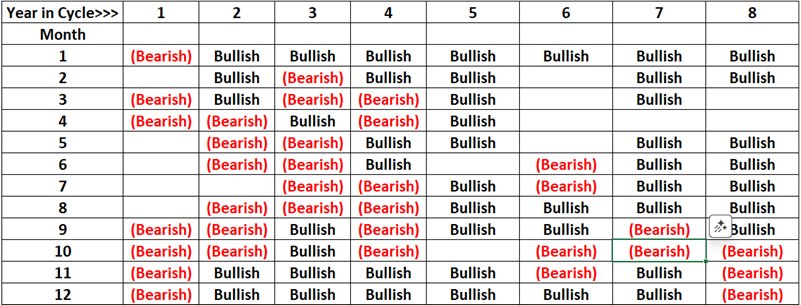
The most recent 8-year cycle began in January 2021, so we are now in Year 6, Month 1, in the table above. January is deemed "Bullish" for gold stocks. The next four months are blank, or "Neutral." The calendar then alternates with two "Bearish" months in June and July, two "Bullish" months in August and September, two more "Bearish" months in October and November, before a four-month "Bullish" stretch starting in December 2026.
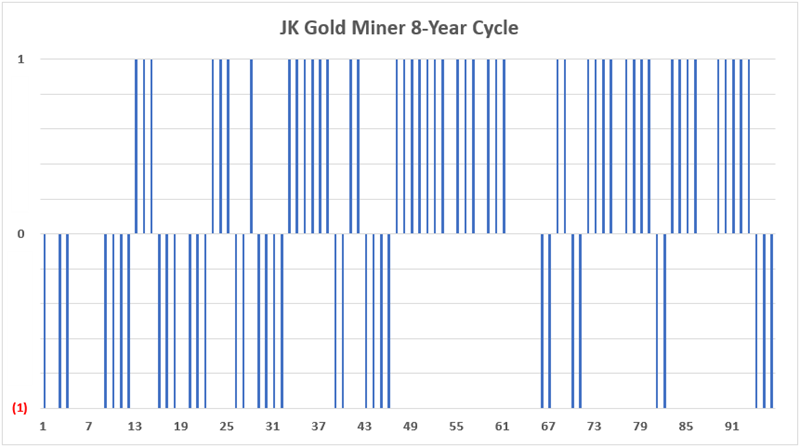
Another way to view the calendar is shown in the chart below. "Bullish" months are assigned a value of +1, "Bearish" months are assigned a value of -1, and "Neutral" months are assigned a value of zero. The current cycle started in January 2021 and will extend through December 2028. A new 8-year cycle will begin in January 2029 and extend through December 2036.
HUI performance during "Bullish" months
The chart below displays the hypothetical growth of $1 invested in the Gold Bugs Index (HUI) only during months considered "Bullish" in the JK 8-Year Gold Stock Calendar.
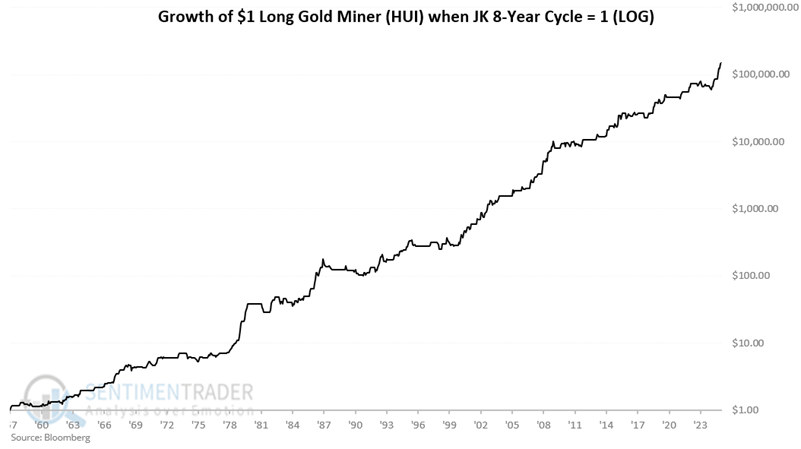
From December 31st, 1957, through December 31st, 2025, a hypothetical $1 grew to $149,961, or 14,995,983%. Note again that these are hypothetical and not real-world trading results.
HUI performance during "Neutral" months
The chart below displays the hypothetical growth of $1 invested in the Gold Bugs Index (HUI) only during months considered "Neutral" in the JK 8-Year Gold Stock Calendar.
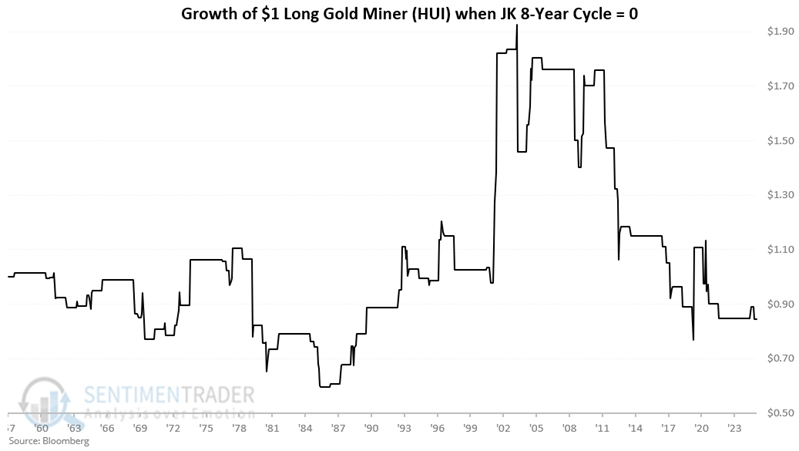
From December 31st, 1957, through December 31st, 2025, a hypothetical $1 shrank to $0.85, or -15%.
HUI performance during "Bearish" months
The chart below displays the hypothetical growth of $1 invested in the Gold Bugs Index (HUI) only during months considered "Bearish" in the JK 8-Year Gold Stock Calendar.
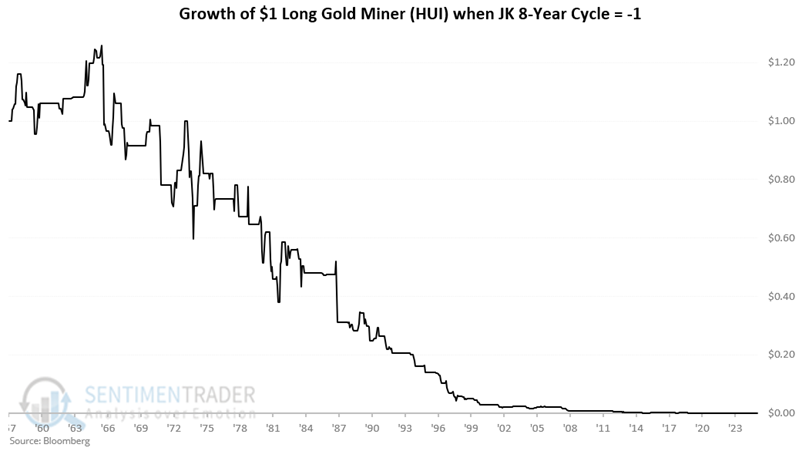
From December 31st, 1957, through December 31st, 2025, a hypothetical $1 shrank to $0.0012, or -99.9%.
The chart below displays the same results on a logarithmic basis.
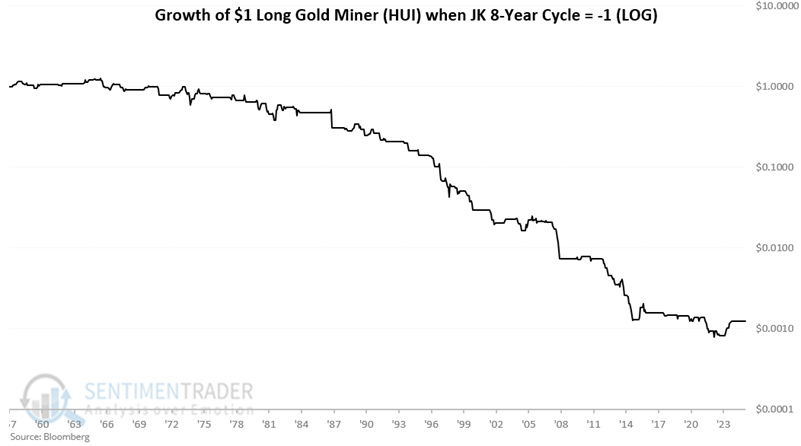
Note that the seemingly small bounce at the far right of the chart above was, in percentage terms, a significant advance. This is a warning sign that selling short gold miners when the calendar is bearish still carries inherent risks, despite the long-term bearish returns.
Comparing the Results
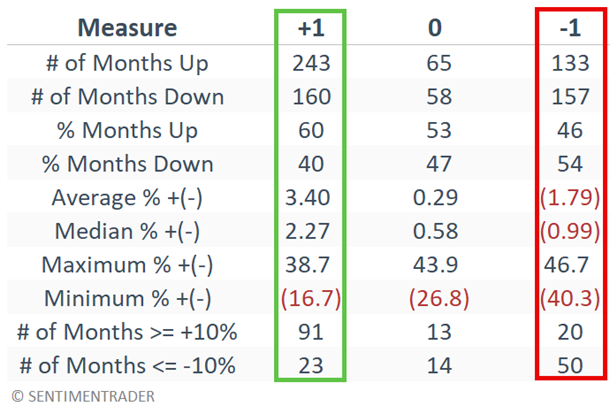
The table below summarizes monthly performance results for ticker HUI during months labeled Bullish (+1), Neutral (0), and Bearish (-1).
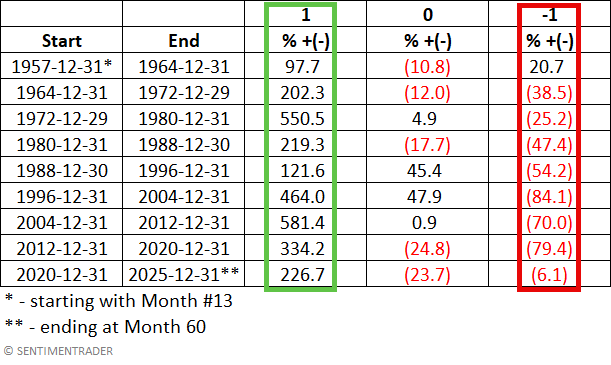
The table below displays cumulative results for Bullish, Neutral, and Bearish months across each 8-year cycle. Note that the first line starts on December 31st, 1957 (January 1958 is Month #13 on the 8-year cycle that began in January 1957). Also, the last line ends on December 31st, 2025, which is month 60 of the current 8-year period that started in January 2021 and ends in December 2028.
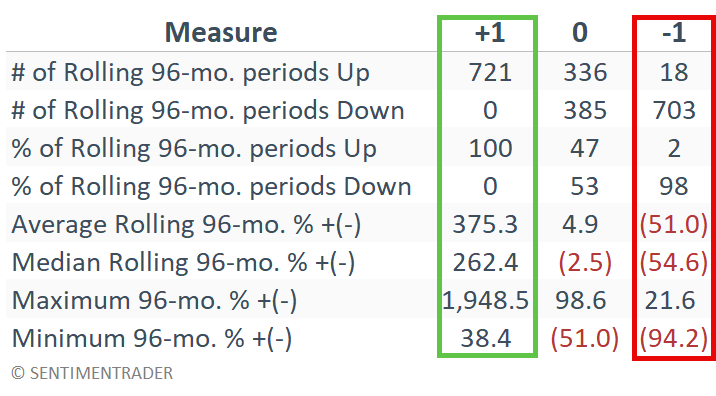
Finally, the table below looks at results for all 96-month rolling periods. The first 96-month rolling period extended from December 31st,1957, through December 31st, 1965. The most recent completed 96-month rolling period began December 31st, 2017, and ended December 31st, 2025.
What the research tells us…
The results above are compelling. However, the real question is "How likely are they to continue?" Unfortunately, that question can only be answered in hindsight. In terms of real-world trading, no one should assume that they can take a long position in gold miners when the calendar is bullish (and, potentially, short gold miners when the calendar is bearish) and wait for the vast profits to roll in.
It is also important to note that the ticker HUI is an index, not a tradable security. Traders wishing to employ the calendar might consider a gold miner ETF such as VanEck Gold Miners ETF (ticker GDX) to play the long side, and potentially, the Direxion Daily Gold Miners Index Bear 2x Shares (ticker DUST) to play the short side. It is important to note that ticker DUST is a 2x inverse leveraged fund and, as such, is prone to significant price movements.
Aside from the hypothetical results detailed above, traders must carefully consider their own risk tolerance before investing in gold mining stocks.