Products
SentimenTrader Trading Tools
‍
Backtest Engine
My Trading Toolkit
Correlation Analysis
Seasonality
Market Prediction
Indicators & Data API
‍
Proprietary Indicators & Charts
Market Data API
Strategies & Scanner
‍
50+ Trading Strategies
Smart Stock Scanner
Smart Option Scanner
Research Reports
‍
Research Solutions
Reports Library
Free Resources
Simple Backtest Calculator
Simple Seasonality Calculator
The Kelly Criterion Calculator
Sentiment Geo Map
Public Research Reports
Education
Sentiment Indicators
Technical Indicators
Pricing
Company
About
In the News
Testimonials
Client Success Stories
Contact
Log inLoginSign up
< BACK TO ALL REPORTS

Into the eye of the seasonal storm?

Jay Kaeppel
2023-08-21
As the stock market enters the weakest annual period already in a short-term downtrend, we examine history to help investors set proper expectations.

Key points

  • The stock market has sold off in the last three weeks - and some indicators are reaching potentially oversold levels
  • However, the S&P 500 is entering its weakest seasonal period of the year
  • This does not necessarily mean a continuation of the recent downtrend, but it does argue in favor of caution

Heading into the weakest time of year for stocks

The chart below displays the annual seasonal trend for the S&P 500 Index.

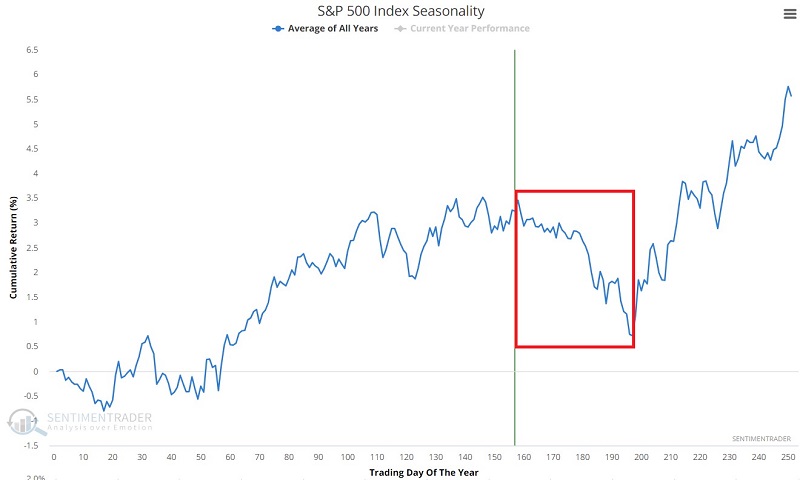
As you can see in the chart above, we are entering what is generally the weakest part of the year for stock market performance. This period extends from the close of Trading Day of Year (TDY) #158 through TDY #197. While this appears pretty ominous in the chart above, it is essential to remember that annual seasonal charts are an average of what has happened in the past and not a roadmap of what will happen this time around. For 2023, this period extends from the close on 2023-08-21 through 2023-10-16.

So should investors heed the gathering storm clouds and board up the windows, or continue to go about their business? To steal a phrase, "It's complicated."

SPX seasonal weakness by the numbers

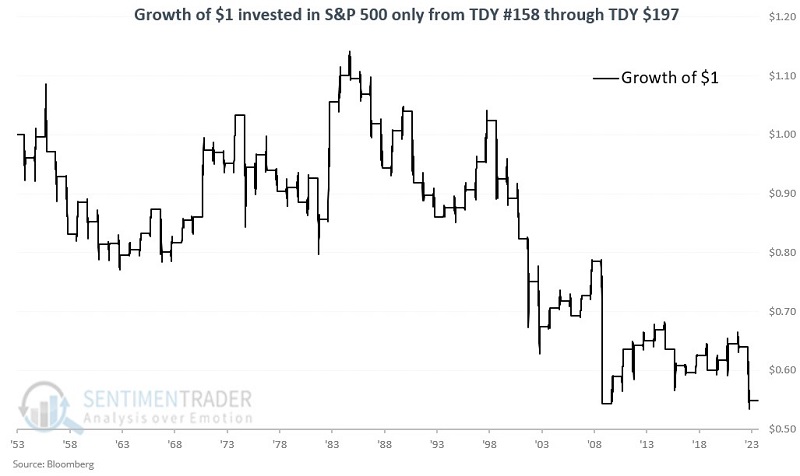
The chart below displays the growth of $1 invested in the S&P 500 Index only from TDY #158 through TDY #197 since 1953.  

The table below summarizes SPX's performance during this annual period.

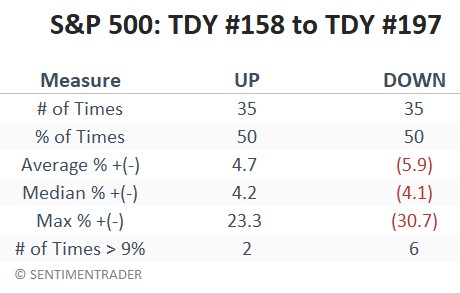
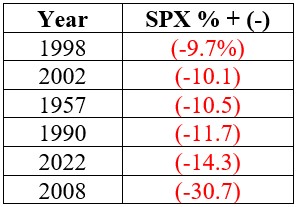
First, year-by-year results are essentially a coin flip, with 35 years showing a gain and 35 showing a loss. That's the good news. The bad news is that the down years tend to be down more than the up years are up. Note also that up years showed a gain over +9% only twice (+23.3% in 1982 and +13.2% in 1970), while down years showed a loss of over -9% six times, as shown below:


What about pre-election years?

Pre-election years have long shown a tendency to be bullish on the whole (no down pre-election years since 1930s). Does the unfavorable TDY #158 through TDY #197 period also show better results than average during pre-election years? The correct answer is probably "Yes, but."

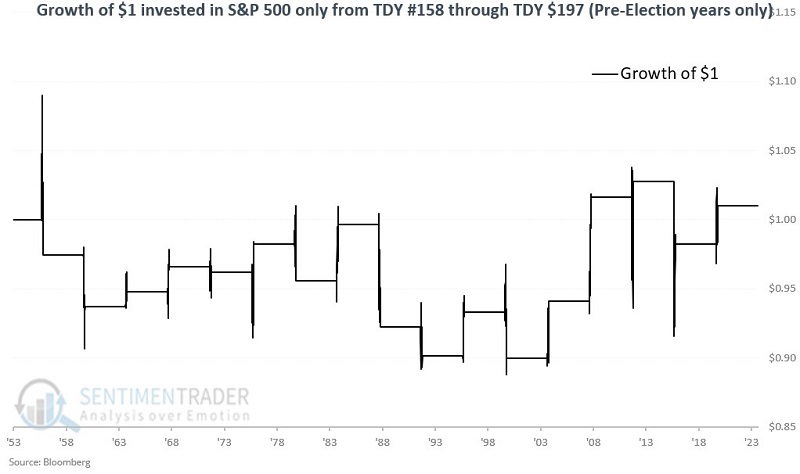
The chart below displays the growth of $1 invested in the S&P 500 Index from TDY #158 through TDY #197 only during pre-election years.

The table below summarizes SPX's performance.

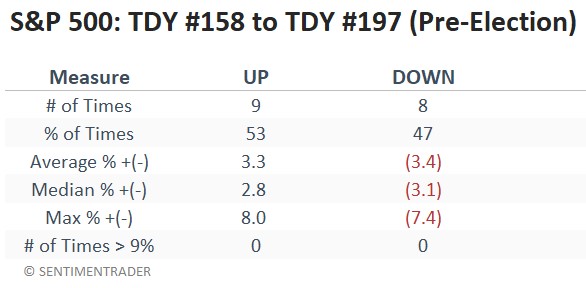
The good news is that pre-election results have tended to be somewhat better than during other years. Nine out of 17 years (53%) have shown a gain, and the net result is a meager cumulative gain of +1% - but a gain nevertheless, rather than a loss. Also, the worst SPX performance within a pre-election year during this unfavorable seasonal period was -7.4%. Not something an investor would hope for, but a far cry better than several other years.

What the research tells us…

The research tells us two things. First, on a year-to-year basis, the weakest seasonal period is essentially a coin flip. However, it also tells us that the overall long-term results skew meaningfully to the downside. "Hope for the best, but prepare for the worst" appears to be an appropriate phrase for the next roughly two months.

PRODUCTS
SentimenTrader
Trading Tools
Indicators & Data API
‍
Strategies & Scanner
‍
Research Reports
FREE
RESOUrCES
Simple Backtest
Calculator
Simple Seasonality
Calculator
The Kelly Criterion
Calculator
Sentiment Geo Map
‍
Public Research Reports
‍
Education
Sentiment Indicators
‍
Technical Indicators
‍
Pricing
Bundle pricing
‍
FAQ
‍
Announcements
‍
COMPANY
‍
About
‍
In the News
‍
Testimonials
‍
Client Success Stories
CONTACT
‍
General Inquiries
‍
Media Inquiries
‍
Financial Professionals Inquiries
‍
© 2026 Sundial Capital Research Inc. All rights reserved.
Setsail Marketing
TermsPrivacyAffiliate Program
Risk Disclosure: The information and tools provided are for research and analytical purposes only and are not intended as investment advice. Market analysis involves uncertainty, and outcomes may differ from expectations. Users should conduct their own due diligence and consider their individual circumstances before making any financial decisions. Past performance is not necessarily indicative of future results.

Hypothetical Performance Disclosure: Hypothetical performance results have many inherent limitations, some of which are described below. No representation is being made that any account will or is likely to achieve profits or losses similar to those shown; in fact, there are frequently sharp differences between hypothetical performance results and the actual results subsequently achieved by any particular trading program. One of the limitations of hypothetical performance results is that they are generally prepared with the benefit of hindsight. In addition, hypothetical trading does not involve financial risk, and no hypothetical trading record can completely account for the impact of financial risk of actual trading. for example, the ability to withstand losses or to adhere to a particular trading program in spite of trading losses are material points which can also adversely affect actual trading results. There are numerous other factors related to the markets in general or to the implementation of any specific trading program which cannot be fully accounted for in the preparation of hypothetical performance results and all which can adversely affect trading results.

Testimonial Disclosure: Testimonials appearing on this website may not be representative of other clients or customers and is not a guarantee of future performance or success.