
Interest rate trends and stock prices

Key points
- Interest rates are one of many factors that influence stock prices
- Interest rate trends are often more important than absolute levels
- A simple range indicator may be a valuable weight of the evidence tool for stock traders
Stocks and interest rates have a long (and complicated) history
The chart below displays the action for the S&P 500 Index and ticker $TNX (the 10-year treasury yield - multiplied by ten for some reason) since 1993.
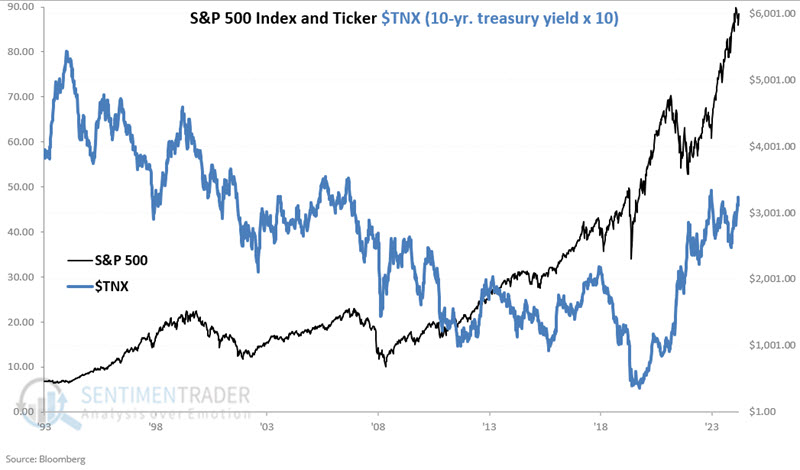
The two data series in the chart above have a correlation coefficient of -0.48 across 30+ years, which implies a meaningful inverse relationship between them. This makes sense, as it is conventional wisdom that rising rates are bad for stocks and vice versa. Yet, in the chart above, we see significant bear markets (2000 to 2002 and 2007 to 2009) accompanied by declining rates. Conversely, although rates have risen significantly since March 2020, the stock market has soared. So what gives?
There are two key things to note. First, interest rates are only one of many factors that influence stock prices (go to this link and scroll down to the 12.11.2024 webinar video for more details). Secondly, the relationship between stocks and interest rates is not static but can vary significantly over time. To illustrate, the chart below displays the correlation between the S&P 500 and ticker TNX over the most recent 52-week period. Note the vast swings and that at different times, stocks and bond yields can be a) highly correlated, b) highly uncorrelated, or c) somewhere in between.
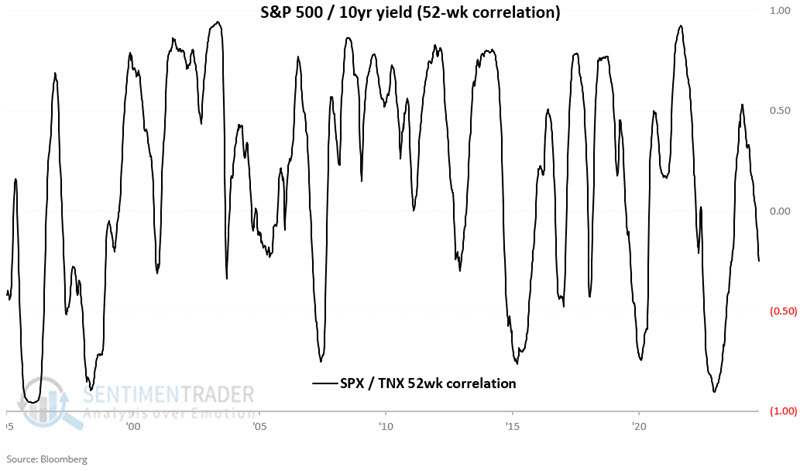
While the correlation over the past 31 years is negative, the average 52-week period correlation is positive at 0.16. Confused yet? It is a little challenging to know what to make of all this. So, let's move beyond the standard "lower rates are good, higher rates are bad" mindset and take a different tack in identifying the trend in interest rates and what that trend might mean for stocks.
Measuring TNX relative to the 13-week range
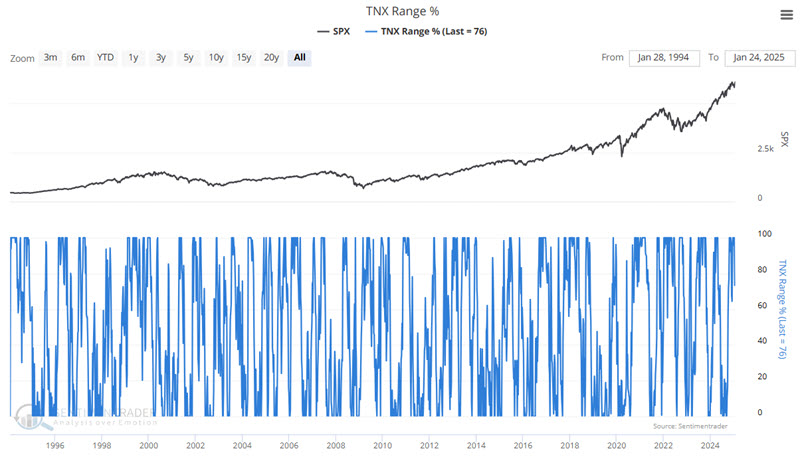
Here, we introduce a new indicator titled TNX Range %. The TNX Range % is an indicator that measures the position of the 10-year Treasury yield (TNX x 10) relative to its highest and lowest closes over the past 13 weeks. This indicator is designed to assess market conditions, where a lower reading suggests favorable conditions for stocks, and a higher reading indicates potential market challenges. The TNX Range % is especially useful for understanding the broader economic environment, offering insights into interest rate trends and their impact on the stock market. Traders and investors can use the TNX Range % to gauge the strength of the market and adjust their strategies accordingly.
We will assess the level of 10-year treasury yields at the end of each week relative to the 13-week range. Each week, we make the following calculations:
A = Highest weekly close for TNX in the last 13 weeks
B = Lowest weekly close for TNX in the latest 13 weeks
C = This week's close for TNX
D = (A - B)
E = (C - B)
F = (E / D) * 100
In other words, we calculate (Latest TNX - lowest 13-week close for TNX) / (highest 13-week close for TNX - lowest 13-week close for TNX) x 100
- Our TNX Range % indicator can range from 100 to 0
- If TNX closes for a week at its highest reading in 13 weeks, the indicator will read 100
- If TNX closes a week at the lowest reading in 13 weeks, the indicator will read 0.0
The chart below displays the weekly values since early 1994.
For our purposes, a reading:
- Below 83% is favorable for stocks
- 83% or higher is unfavorable for stocks
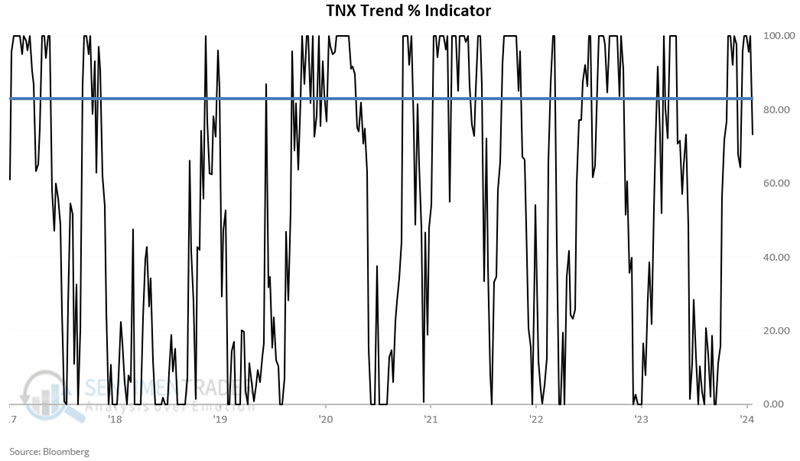
The chart below zeroes in on the last 10 years. A line is added at 83% for illustrative purposes.
Using the TNX Range % as a stock market weight of the evidence indicator
For testing purposes, we will consider any TNX Range % reading below 83% as favorable for stocks and any 83% or higher reading as unfavorable for stocks.
The chart below displays the hypothetical growth of $1 invested in the S&P 500 (SPX) only when the TNX Range % indicator is less than 83%.
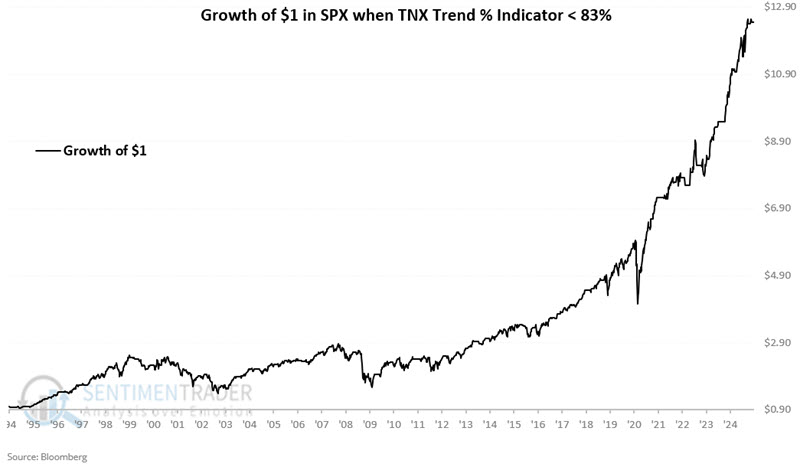
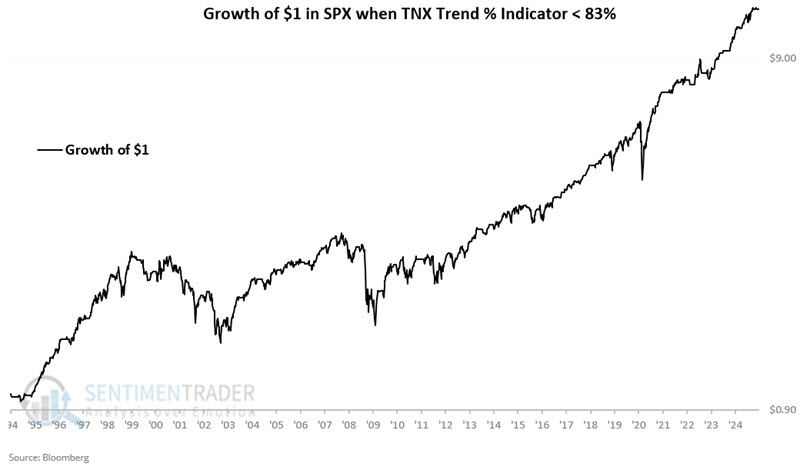
The cumulative hypothetical gain from 1994-01-28 through 2025-01-17 is +1,145.7%. The chart below displays the same information as the chart above on a logarithmic scale.
The stock market is not impervious to declines simply because this indicator is considered "favorable." Remember that interest rates are only one factor that influences stock prices. Also, this indicator is intended to be used as a weight of the evidence indicator and not as a standalone trading model.
On the flip side, the chart below displays the hypothetical growth of $1 invested in the S&P 500 (SPX) only when the TNX Range % indicator is 83% or higher.
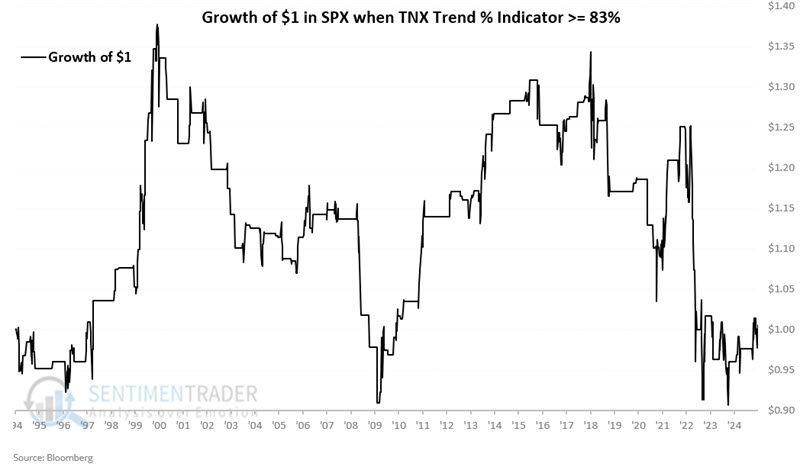
It should be noted that during these periods, the S&P achieved a net gain of +0.6%. So, it would be inaccurate to consider this situation as "bearish" for stocks. So, let's describe this state of affairs (i.e., TNX in the upper 17% of its 13-week range) as "unfavorable" for stocks.
The key point is that stock market performance has been consistently and vastly better (+1,145.7% versus +0.6%) when the TNX Range % indicator is "favorable" (i.e., below 83%) than when it is "unfavorable" (i.e., 83% or higher).
The table below summarizes weekly S&P 500 performance during all favorable and unfavorable periods since 1994.
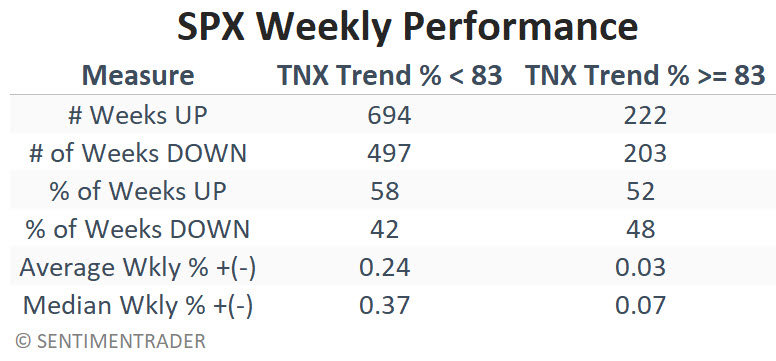
Note that the S&P 500 has shown a higher percentage of up weeks (58% to 52%) and higher Average and Median weekly returns (+0.24% and +037%, respectively) when the TXN Trend % indicator was below 83% than when it was above that level (average and median weekly returns of just +0.03% and +0.07%, respectively).
Current Status
Most recently, the TNX indicator was unfavorable from 2024-12-13 through 2025-01-17 before turning favorable again at the close on 2025-01-17.
What the research tells us…
There is, inarguably, an essential relationship between stocks and interest rates. However, it appears to be much more complex than simply "lower rates good, higher rates bad." Likewise, recognizing that other factors influence stock prices is essential to long-term success. As a result, the indicator detailed above should be viewed as weight of the evidence and not as an automatic trading signal. Considering those caveats, the TNX Range % indicator detailed above offers a valuable clue for investors to gauge whether interest rate action is favorable or unfavorable for stocks.