
Interest rate cycles I have known and loved - Part II

Key points
- Interest rates tend to move in long-term waves
- Three distinct cycles plus one trend-following method have stayed mainly on the right side of bond price movements for over 100 years
- In Part II, we combine the four indicators into the JK Bond Cycle Thermometer
- The JK Bond Cycle Thermometer can read from 0 to +4; It presently reads 0, which is considered bearish for bonds
A Review of Part I
In Part I, we highlighted three cyclical factors and one trend-following factor. A quick review:
60-Year Cycle: The most recent cycle began on 1980-12-31 with a 30-year downtrend in interest rates (i.e., bullish for bonds) and reversed to (theoretically) a 30-year uptrend on 2010-12-31 (i.e., bearish for bonds). This bearish phase is slated to last until the end of 2040.
45-Month Cycle: This cycle trends bullish for bonds for 22 months and bearish for bonds for 23 months. Most recently, this Thermometer turned bearish for bonds at the end of February 2024 and will remain so until the end of January 2026.
Election Cycle Months: This cycle will be bullish for bonds during June, July, November, and December 2024. All other months (except January 2024, which was bullish for bonds) during an election year are bearish.
10-Year Yields vs. 120-month Exponential: Ticker $TNX rose above its 120-month EMA at the end of March 2022. This indicator has been bearish for bonds ever since and will remain so until $TNX closes a month below its 120-month EMA.
The JK Bond Cycle Thermometer
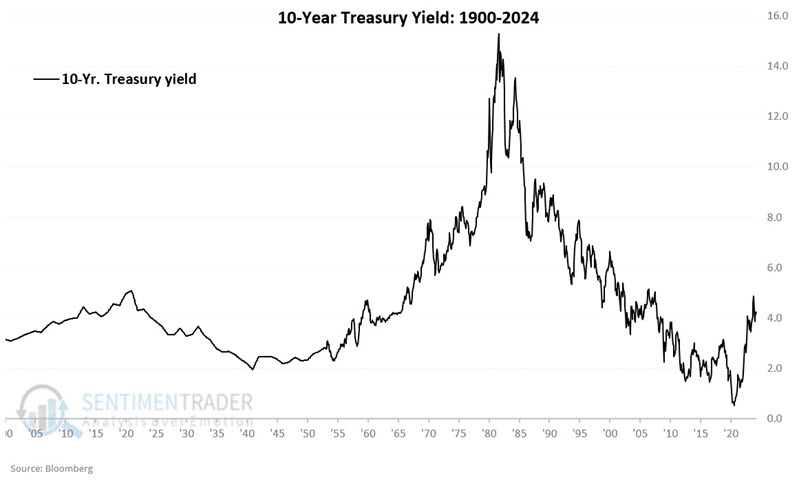
The chart below displays the 10-year Treasury Yield at the end of each month since 1900. Remember that declining yields are bullish for bond prices, and rising yields are bearish for bond prices.
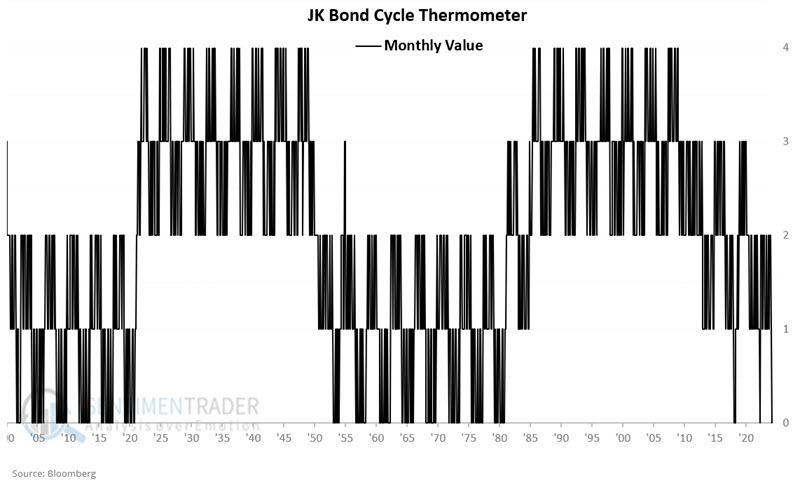
The JK Bond Cycle Thermometer notes the number of bullish measures at the end of a given month and can read 0, +1, +2, +3, or +4. All four of these factors are currently rated as bearish for bonds. The chart below displays the month-end value of the JK Bond Cycle Thermometer since 1900.
The chart below overlays the two charts above. The chart displays the month-end value of the JK Bond Cycle Thermometer reading using the axis on the left overlaid with the 10-Year Treasury Yield (using the axis on the right).
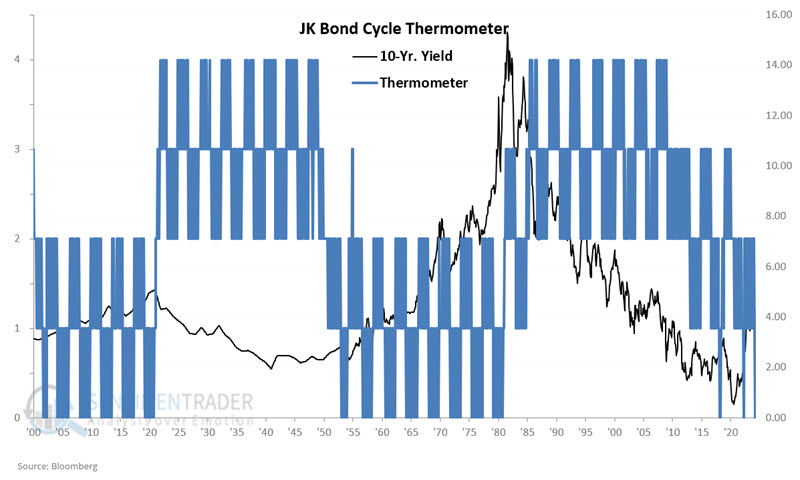
We can note in the chart above that during long periods of declining rates (1920-1950 and 1980 to 2010), the Thermometer was typically at a reading of +2 or more. Conversely, during long periods of rising rates (1900-1920, 1950-1980, and 2020-2024), the Thermometer was typically at a reading of +2 or less.
How we will measure the results
As in Part I, we will track cumulative results by monitoring changes in the yield on 10-year treasury notes using month-end data starting in 1900. Remember that higher Thermometer readings (and declining yields) are bullish for bond investors and that lower Thermometer readings (and rising yields) are bearish for bond investors.
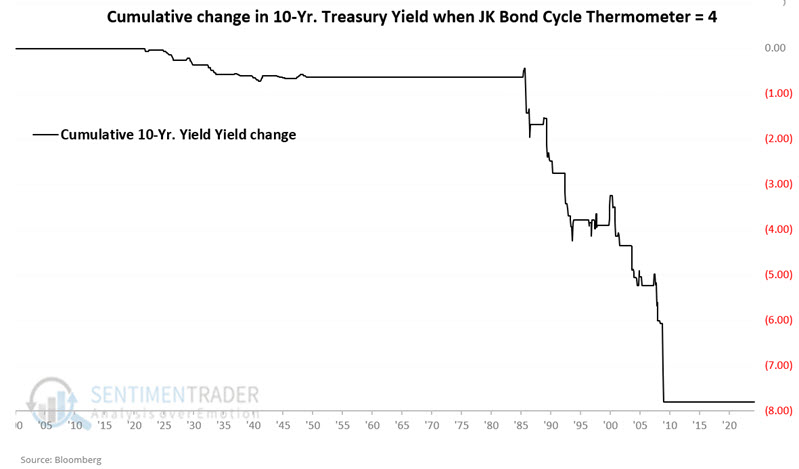
The chart below displays the cumulative change in 10-year treasury yields (-7.80 yield points) while the JK Bond Cycle Thermometer is equal to +4.
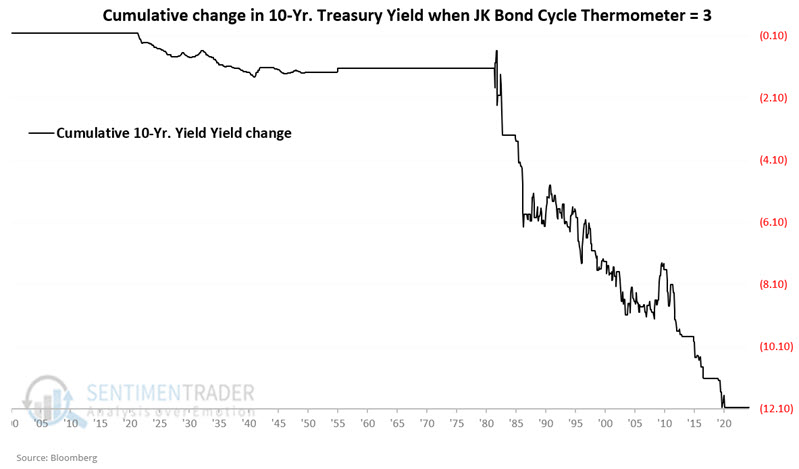
The chart below displays the cumulative change in 10-year treasury yields (-12.06 yield points) while the JK Bond Cycle Thermometer is equal to +3.
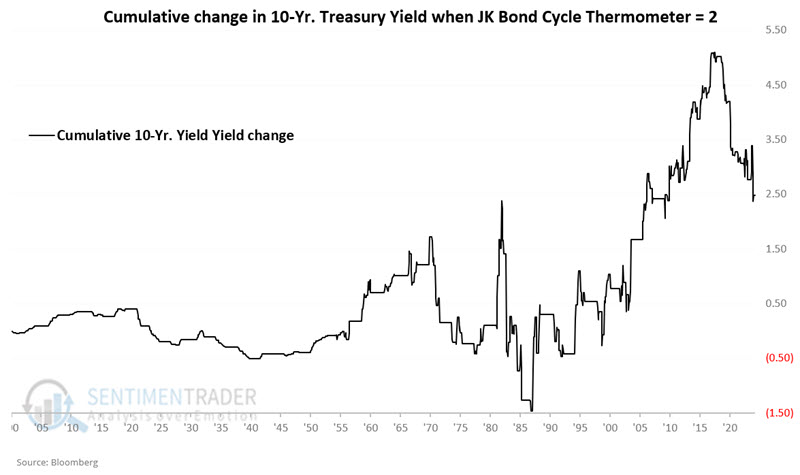
The chart below displays the cumulative change in 10-year treasury yields (+2.48 yield points) while the JK Bond Cycle Thermometer was equal to +2.
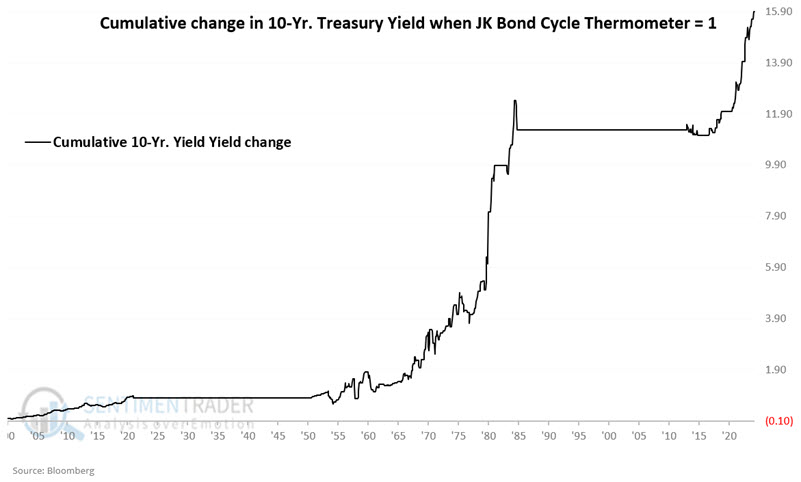
The chart below displays the cumulative change in 10-year treasury yields (+15.91 yield points) while the JK Bond Cycle Thermometer was equal to +1.
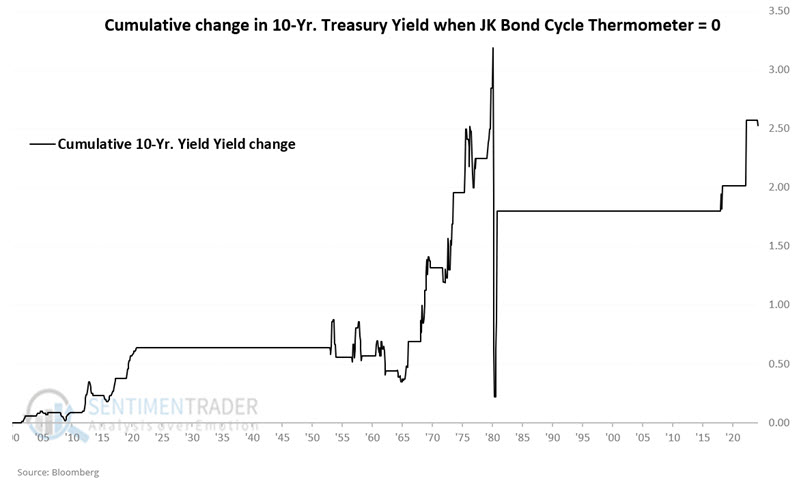
The chart below displays the cumulative change in 10-year treasury yields (+2.53 yield points) while the JK Bond Cycle Thermometer is equal to +0.
Combining extreme readings
in the charts above, readings of +4 and +3 tended to witness declining interest rates (i.e., bullish for bond prices). Conversely, readings of +1 and 0 tended to witness rising interest rates (i.e., bearish for bond prices). Readings of +2 witnessed wildly diverse interest rate movements.
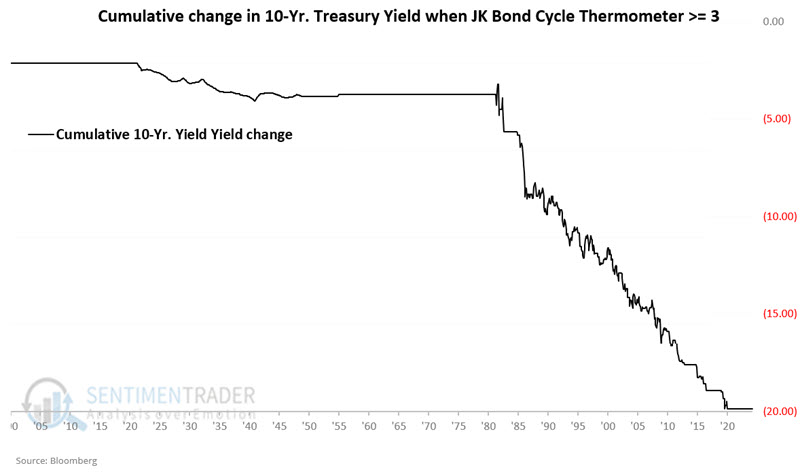
The chart below displays the cumulative change in 10-year treasury yields (-19.87 yield points) while the JK Bond Cycle Thermometer was greater than or equal to +3.
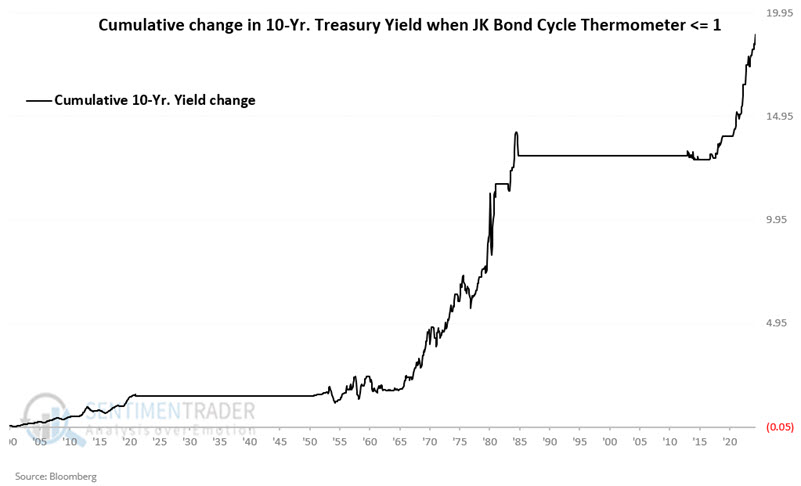
The chart below displays the cumulative change in 10-year treasury yields (+18.44 yield points) while the JK Bond Cycle Thermometer was less than or equal to +1.
What the research tells us...
The JK Bond Cycle Thermometer offers a potential clue regarding the trend for interest rates. This measure currently stands at 0 - i.e., suggesting higher yields, which is, therefore, (theoretically) bearish for bond prices. This reading will remain 0 or +1 until May 2026 UNLESS the 10-year treasury yield falls back below its 120-month EMA between now and then. It should be remembered that cycles can be beneficial right up until the point that they don't work anymore, and the reality is that why they work and why they may suddenly stop working cannot really be explained. So, a "leap of faith" is undeniably involved in investing hard-earned money based on any seasonal or cyclical pattern. That said, 120+ years of mostly being on the right side seems worthy of consideration.