
Interest rate cycles I have known and loved - Part I

Key points
- Interest rates tend to move in long-term waves
- Three distinct cycles plus one trend-following method have stayed mainly on the right side of bond price movements for over 100 years
- This piece will look at the 60-year cycle, the 45-month cycle, my own Election Cycle Months Calendar, and treasury yields versus their long-term moving average
How we will measure the results
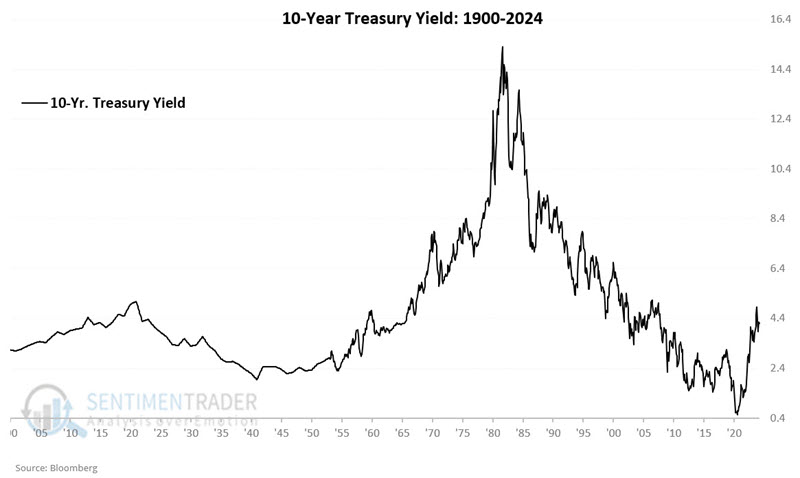
The text below highlights three interest rate-related cycles plus one trend-following method. To measure performance, we will track monthly changes in the yield on 10-year treasury notes using month-end data starting in 1900.
The chart below displays month-end 10-year treasury yields since 1900.
Note that:
- We use the terms "interest rate" and "yield" interchangeably. For example, if we state that the "yield" on 10-year treasuries rose from 2% to 4%, that is the same as saying "the interest rate on 10-year treasuries rose from 2% to 4%"
- Bond prices move inversely to interest rates, i.e., as interest rates decline, bond prices rise and vice versa
- If we state that a particular cycle is "bullish," this means that we expect interest rates to fall (and bond prices to rise)
- If we state that a particular cycle is "bearish", this means that we expect interest rates to rise (and bond prices to fall)
The 60-year cycle
Interestingly, interest rates have historically tended to move in roughly 60-year waves, 30 years down, and then 30 years up. The chart below displays this phenomenon.
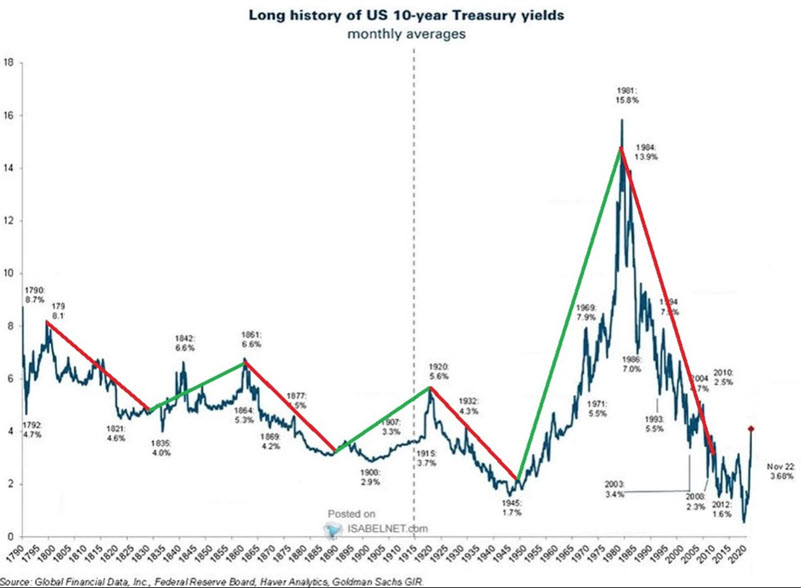
It is important to note that this is NOT an exact cycle - i.e., peaks and troughs do not occur on an exact schedule, and interest rates do not move perpetually higher or lower depending on the phase of the cycle. The purpose of employing this cycle is merely to tell us "in which direction we should be looking" at any given point in time.
Still, this cycle has done a surprisingly good job of capturing the bulk of interest rate movements.
We will take a closer look at actual historical results in a moment. But for now, note that after a declining trend from 1920 to 1950 and a rising trend from 1950 to 1980, interest rates were theoretically due for a declining trend from 1980 to 2010. As it turns out, the trend overshot by ten years, as interest rates did not bottom out until March 2020 (did I mention this is not an exact cycle). If this cycle persists, it suggests that interest rates will generally trend higher until roughly 2040. Because this cycle is presently calling for interest rates to rise, it is considered "bearish for bonds (i.e., we would look for generally higher interest rates)."
- The black line in the chart below highlights the net change in 10-year treasury yields when the 60-year cycle was "bullish"
- The blue line in the chart below highlights the net change in 10-year treasury yields when the 60-year cycle was "bearish"
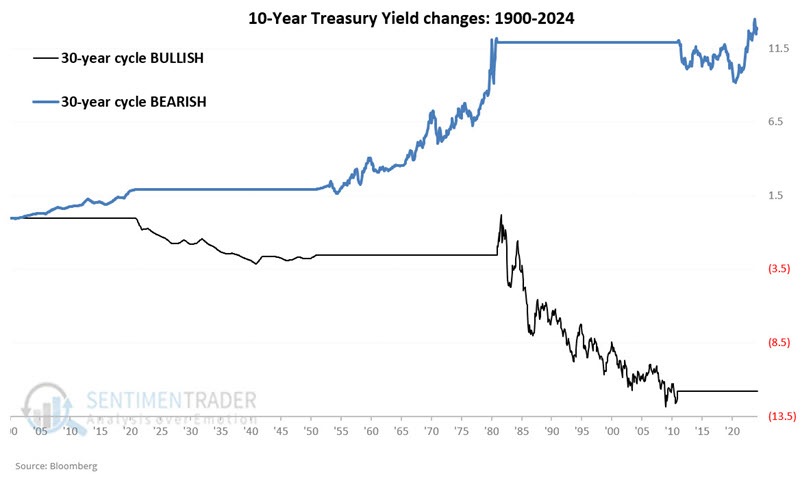
- When the 60-year cycle was bullish for bonds, 10-year yields declined a total of -11.79 points
- When the 60-year cycle was bearish for bonds, 10-year yields gained a total of +12.84 points
The 60-year cycle turned bearish on bonds on 2010-12-31 and will remain so until 2040-12-31.
The 45-Month cycle
The 45-month yield cycle posits that interest rates will trend lower for 22 months and then higher for 23 months.
The first complete 45-month cycle in our test began on 1902-05-31. The cycle was bullish for bonds through 1904-02-29 and bearish from 1904-02-29 through 1906-01-31.
Note that the first five months of our test (from 1899-12-31 through 1902-05-31) were the last five months of a 22-month bullish cycle and were counted as "bullish months" for bonds.
- The black line in the chart below highlights the net change in 10-year treasury yields when the 45-month cycle was "bullish"
- The blue line in the chart below highlights the net change in 10-year treasury yields when the 45-month cycle was "bearish"
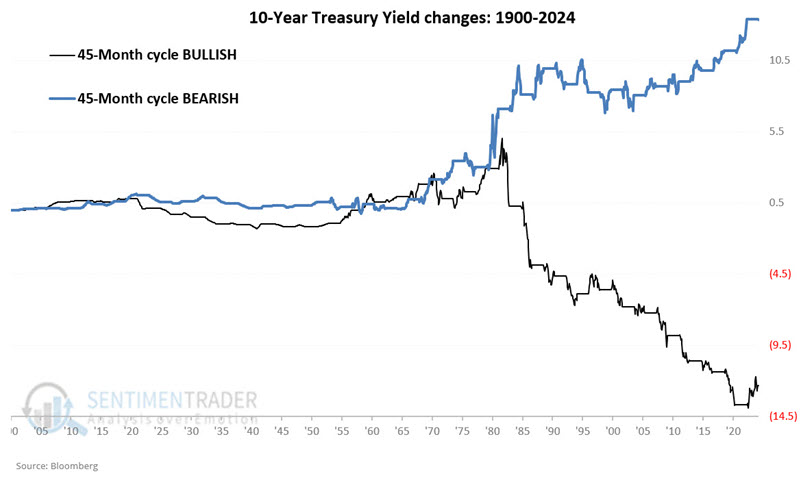
- When the 45-month cycle was bullish for bonds, 10-year yields declined a total of -12.32 points
- When the 60-year cycle was bearish for bonds, 10-year yields gained a total of +13.38 points
The 45-month cycle turned bearish on bonds on 2024-02-29 and will remain so until 2026-01-31.
Lastly, while not covered in detail here, the 45-month cycle has historically been much more effective when aligned with the 60-year cycle. At present, both cycles are bearish for bonds.
The Election Cycle Months Calendar
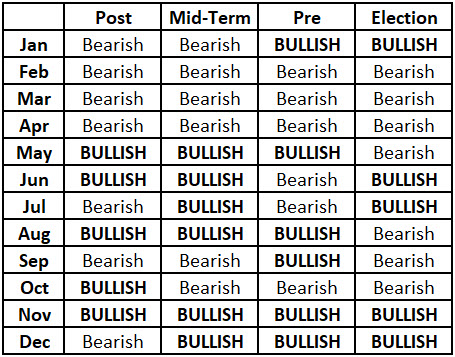
The table below highlights my own Election Cycle Months calendar for treasury securities. In the table, the word "Bullish" means the expectation is for lower yields and higher bond prices. "Bearish" means the expectation is for higher yields and lower bond prices.
- The black line in the chart below highlights the net change in 10-year treasury yields when the 45-month cycle was "bullish"
- The blue line in the chart below highlights the net change in 10-year treasury yields when the 45-month cycle was "bearish"
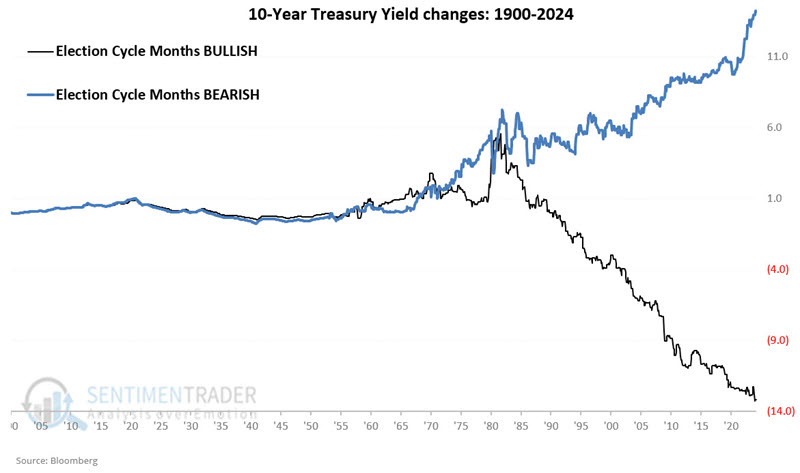
- During "bullish" Election Cycle Months, 10-year yields declined a total of -13.16 points
- During "bearish" Election Cycle Months, 10-year yields gained a total of +14.21 points
As 2024 is an Election year, January, June, July, November, and December are considered bullish for bonds (i.e., the expectation for these months combined is a decline in yields and higher bond prices). All other months in 2024 are considered bearish for bonds.
10-year yields versus their 120-month exponential average
This one is not a cycle per se but rather a trend-following tool. As we have seen, interest rates tend to move in long waves. So, we will apply a 120-month (i.e., 10-year) exponential moving average (see the blue line in the chart below).
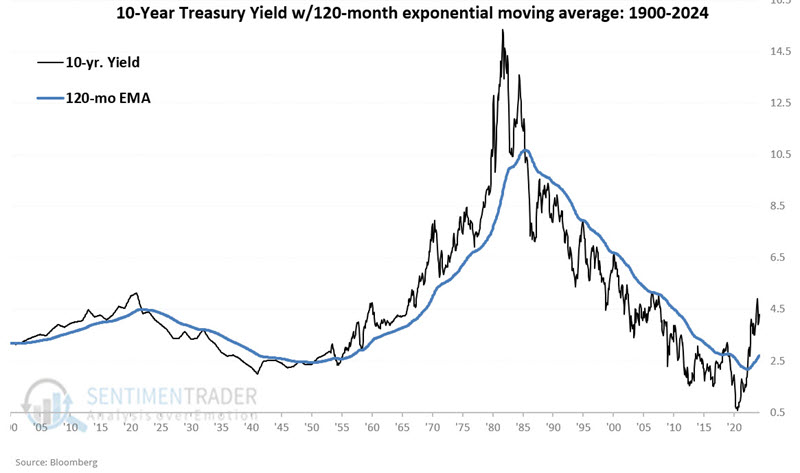
- When the 10-year yield is below its 120-month EMA, that is considered "bullish" for bonds (as interest rates are trending lower)
- When the 10-year yield is above its 120-month EMA, that is considered "bearish" for bonds (as interest rates are trending higher)
The chart below tracks the trend in the 10-year treasury yield depending on whether it is above or below its 120-month EMA.
- The black line in the chart below highlights the net change in 10-year treasury yields when the 10-year yield is below its 120-month EMA.
- The blue line in the chart below highlights the net change in 10-year treasury yields when the 10-year yield is above its 120-month EMA.
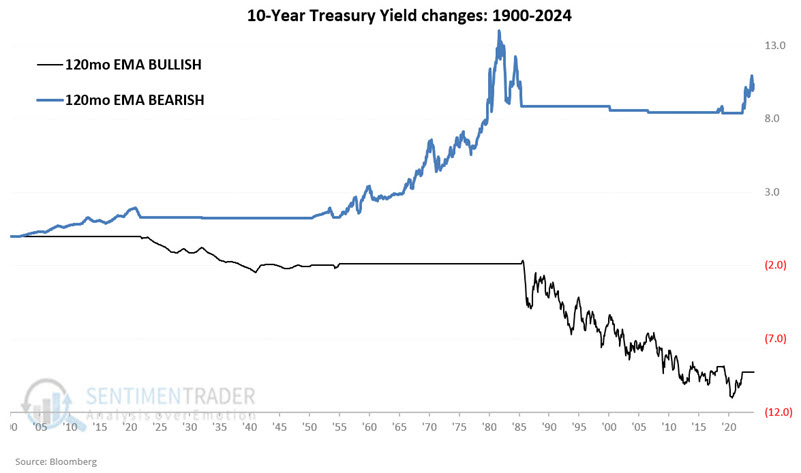
- When 10-year yields were below their 120-month EMA, 10-year yields declined a total of -9.24 points
- When 10-year yields were above their 120-month EMA, 10-year yields gained a total of 10.30 points
10-year treasury yields closed above their 120-month EMA on 2022-03-31. Since then, this trend-following indicator has been considered bearish for bonds, and the 10-year treasury yield has risen from 2.327% to 4.206% at the end of March 2024. This indicator will remain bearish until 10-year treasury yields close a month back below their 120-month EMA. The 10-year yield closed March 2024 at 4.206, and the 120-month EMA was at 2.68.
What the research tells us…
We cannot fully explain the cyclical nature of interest rate trends. Despite that, as a proud graduate of "The School of Whatever Works," all I can offer is that these cycles have kept me mostly on the right side of the bond market for many years. The addition of the 120-month EMA trend-following tool also helps during those inevitable times when bonds don't act "like they're supposed to" based on the cycles. All that said there is no guarantee that any of these will hold up in the future, so bond investors are never relieved of their duty to allocate capital and manage risk intelligently.