
Institutions buy record bets on a crash

Key points:
- The largest options traders spent a record amount on put options last week
- Their total hedging activity is far beyond anything seen in 22 years
- Short-term, that may be a concern, but long-term, it should be a bullish factor
Institutional traders have placed record bets on a crash
In February 2021, small speculators were going bananas. At the time, I showed what was perhaps the most remarkable chart that I'd seen in my entire career.
Until now.
This time, it's not small options traders that have panicked. And it's not FOMO that's causing it. Rather, it's the largest traders in the market, and they're buying protection against a crash at a pace unlike anything the market has ever seen.
Last week, traders of fifty or more contracts bought to open nearly five million put options. More importantly, they spent a whopping $8.1 billion on those contracts. That is almost double the amount of any other week in 22 years.
With options trading, it's essential to consider both sides. Sometimes, when there is a spike in put buying, it's because overall volume is higher, and there is a coincident spike in call buying. So, we prefer to net them out, which is what the chart below shows. It reflects the net dollar value of premiums that institutional traders spent on buying calls to open minus buying puts to open. The lower the blue line, the more they spent on puts.
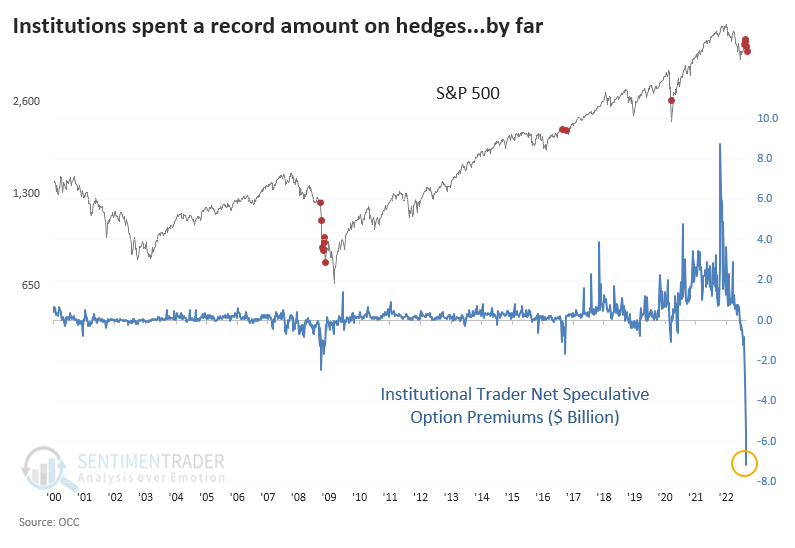
There has never been anything like this in the history of the data. Whenever we see something like this, the first thought is, "Well, maybe it's a data error." And maybe it is. But this is official data reported across all U.S. exchanges, and in the decades we've been following it, there has never been a data error.
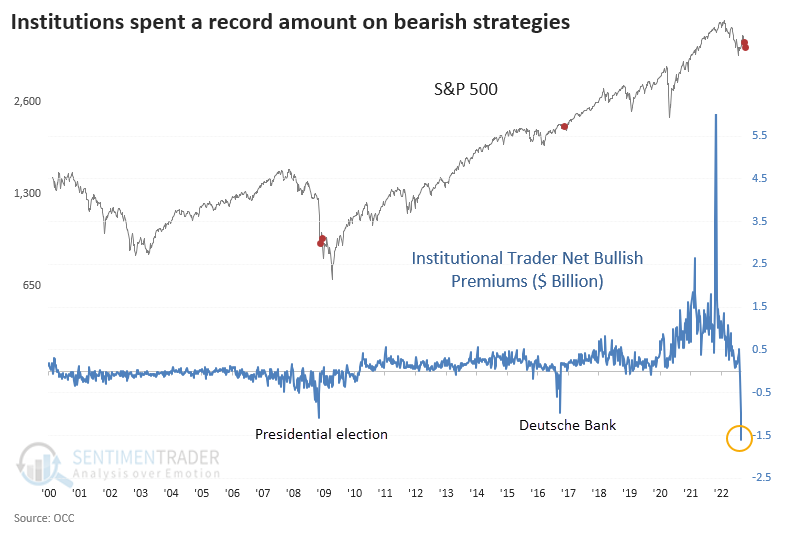
If we look at the total amount of money institutions spent on bullish strategies (buying calls and selling puts) minus bearish ones (buying puts and selling calls), it's also at a record spread. They spent $1.6 billion more on bearish strategies than bullish ones. The prior records were $1.1 billion during the week of November 7, 2008 (global financial crisis, Obama victory), and $970 million the week of September 30, 2016 (Deutsche Bank crisis).
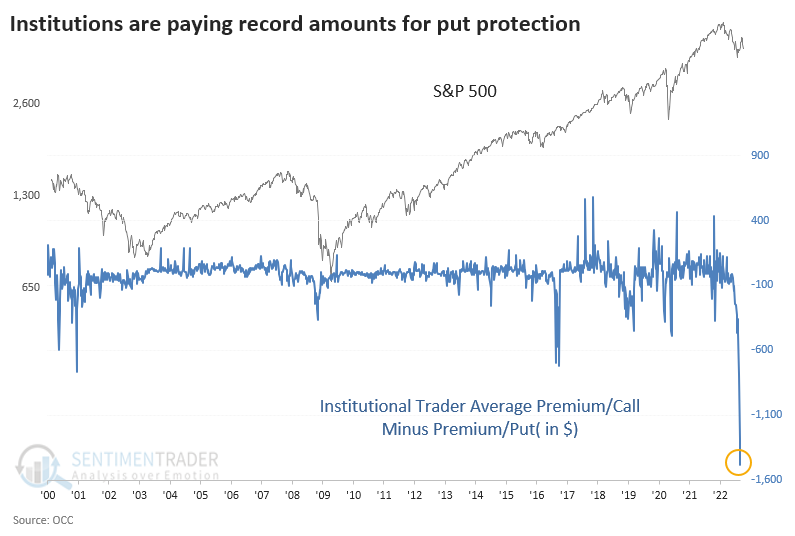
Another way to look at this is the average premium institutions pay for calls versus puts. Last week, they spent an average of $153 per call option. But they spent a jaw-dropping $1,638 per put option. When we net those out, it once again shows the sudden and record-shattering demand for protection against a crash.
While many investors like to assume that big money = smart money, that is not the case. On an individual basis, sure. But in aggregate, they suffer from the same biases and tendency toward herd mentality that everyone else does. When they pay up for calls, stocks are usually near a peak; when they panic-buy hedges, stocks are usually near a low.
A fair point could be made that they scrambled for protection right before the Lehman bankruptcy in 2008 and enjoyed windfall profits. Okay, noted. Though we also have to note that they spent even more on puts into October and November and potentially suffered losses as stocks jumped more than 20% into January 2009. And their other forays into massive put buying didn't seem to work out too well, either.
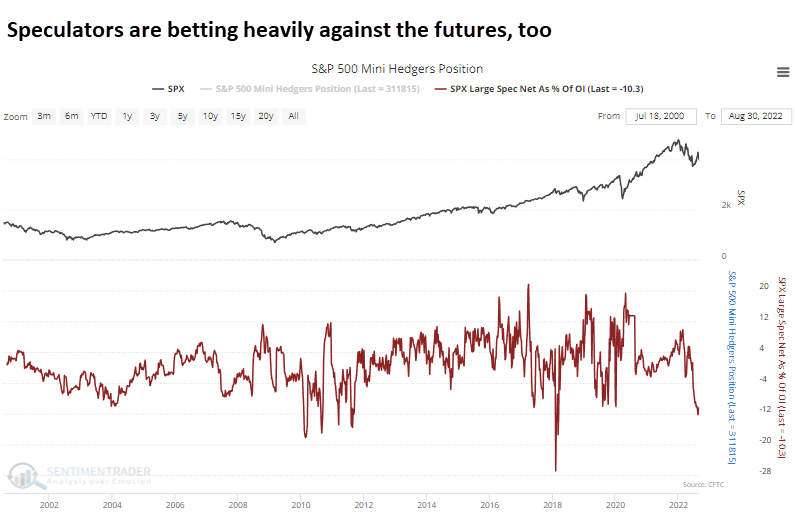
It's not just the options market that is showing heavy bearish bets. Large speculators in S&P 500 e-mini futures have established their largest short position in a decade. As a percentage of open interest, it's among the largest ever.
What the research tells us...
The sudden and massive hedging activity of some of the market's largest traders is unsettling. They have sometimes shown an uncanny ability to buy or sell ahead of significant events in a very short time frame. But the data is too limited to suggest that something is necessarily coming down the pike in the next week or two. More compelling evidence suggests the record put buying is a sign of panic, which has a good track record of preceding rising stock prices over the medium- to long-term.