Products
SentimenTrader Trading Tools
‍
Backtest Engine
My Trading Toolkit
Correlation Analysis
Seasonality
Market Prediction
Indicators & Data API
‍
Proprietary Indicators & Charts
Market Data API
Strategies & Scanner
‍
50+ Trading Strategies
Smart Stock Scanner
Smart Option Scanner
Research Reports
‍
Research Solutions
Reports Library
Free Resources
Simple Backtest Calculator
Simple Seasonality Calculator
The Kelly Criterion Calculator
Sentiment Geo Map
Public Research Reports
Education
Sentiment Indicators
Technical Indicators
Pricing
Company
About
In the News
Testimonials
Client Success Stories
Contact
Log inLoginSign up
< BACK TO ALL REPORTS

Insiders versus everyone else in Financials and Staples

Jason Goepfert
2023-03-28
The Financial sector has suffered heavy and widespread selling pressure in recent weeks, with few members holding above their 50-day moving averages. But corporate insiders in the sectors apparently see value, as they've been buying. Divergences like this have tended to lead to good returns. In the Staples sector, insiders have been much less interested.

Key points:

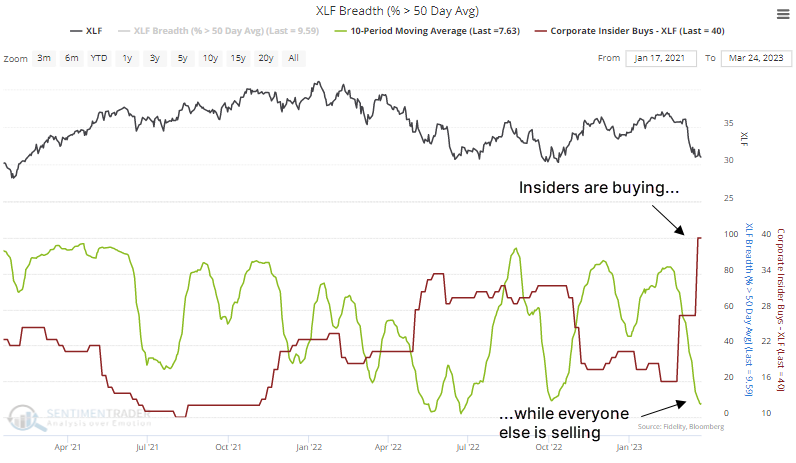
  • As the Financial sector suffers wholesale medium-term selling pressure, insiders have been buying
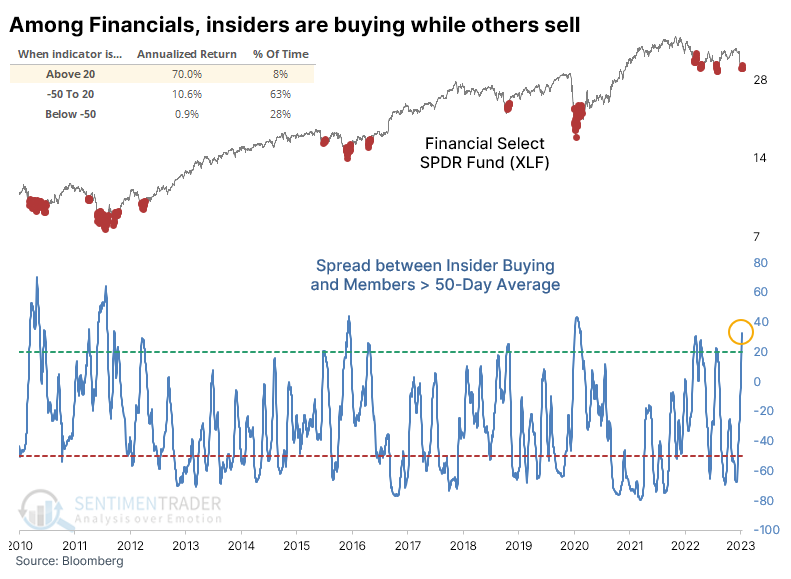
  • Spreads this wide between insiders and everyone else have preceded impressive returns in the sector
  • When compared to insider activity in Staples, similar behavior tended to favor returns in Financials over Staples

Among Financial stocks, insiders are buying up others' sales

Last week, Jay noted that the latest decline in the Financial sector acted like catnip for insiders at those firms. Insiders tend to have a contrarian bent, buying as prices decline and selling as they rally, so the ramp in insider buying isn't a total surprise.

At the same time that insiders were buying, everyone else was selling. Breadth in the Financial sector has been terrible, with an average of fewer than 8% of the stocks holding above their 50-day moving averages over the past two weeks.

Let's look at the spread between insider buying and the average percentage of Financials trading above their 50-day average over the past couple of weeks. It is currently at the highest level since the spring of 2020. When the spread was this wide, the XLF fund returned an annualized +70%.

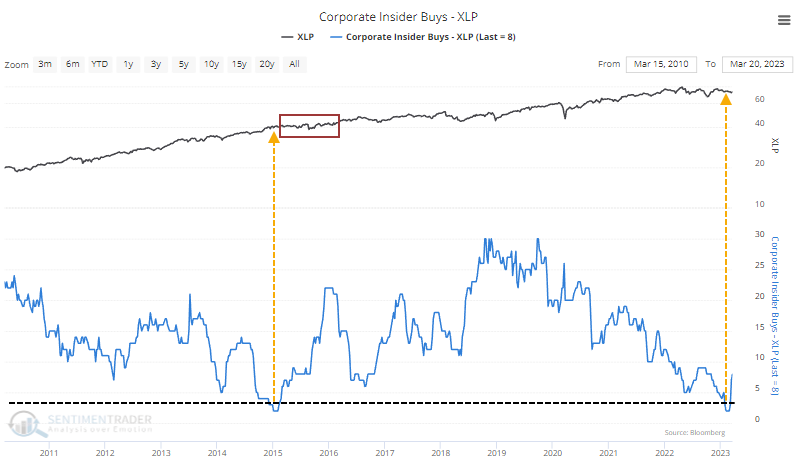
At the same time that insiders got a lot more interested in buying their own shares at Financial firms, insiders in Staples have shown little interest. At those companies, insider buying is only now coming off one of the most apathetic levels in 13 years.

Let's look at the relative interest in insiders vs. everyone else in Financials versus Staples. The chart below shows the spread between insider buying and the percentage of companies trading above their 50-day averages for Financials minus the same calculations for Staples. 

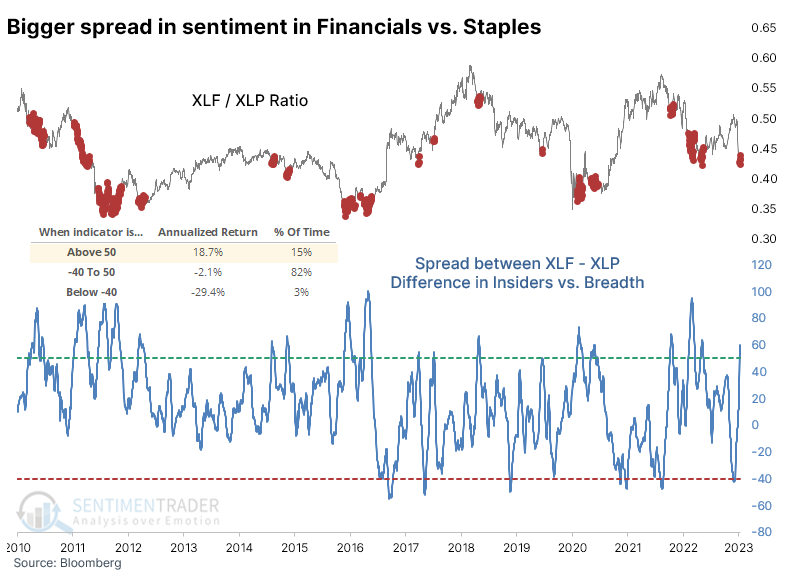
In theory, the higher the spread, the more it should favor Financials over Staples. In practice, that was mostly the case. The ratio advanced at an annualized rate of nearly +19% when the spread was above 50 as it is now. The ratio returned an annualized -29.4% when it was at the opposite extreme.

What the research tells us...

Uptrends have mostly dominated the past 13 years, so it's not unusual for studies to show a positive bias over medium time frames. Even so, when we see situations in a sector or index when insiders appear to be heavily buying amid wholesale selling pressure, it has tended to lead to well above-average returns. That's the case now in Financials. Even though insiders have been more aggressive with their buys, and selling pressure has been worse, the current level has preceded positive expectations.

At the opposite end of the spectrum, insiders have been much less interested in Staples companies, even as breadth has held relatively steady. That has led to a pretty wide divergence between the two sectors, to the degree that has typically favored Financials over Staples.

PRODUCTS
SentimenTrader
Trading Tools
Indicators & Data API
‍
Strategies & Scanner
‍
Research Reports
FREE
RESOUrCES
Simple Backtest
Calculator
Simple Seasonality
Calculator
The Kelly Criterion
Calculator
Sentiment Geo Map
‍
Public Research Reports
‍
Education
Sentiment Indicators
‍
Technical Indicators
‍
Pricing
Bundle pricing
‍
FAQ
‍
Announcements
‍
COMPANY
‍
About
‍
In the News
‍
Testimonials
‍
Client Success Stories
CONTACT
‍
General Inquiries
‍
Media Inquiries
‍
Financial Professionals Inquiries
‍
© 2026 Sundial Capital Research Inc. All rights reserved.
Setsail Marketing
TermsPrivacyAffiliate Program
Risk Disclosure: The information and tools provided are for research and analytical purposes only and are not intended as investment advice. Market analysis involves uncertainty, and outcomes may differ from expectations. Users should conduct their own due diligence and consider their individual circumstances before making any financial decisions. Past performance is not necessarily indicative of future results.

Hypothetical Performance Disclosure: Hypothetical performance results have many inherent limitations, some of which are described below. No representation is being made that any account will or is likely to achieve profits or losses similar to those shown; in fact, there are frequently sharp differences between hypothetical performance results and the actual results subsequently achieved by any particular trading program. One of the limitations of hypothetical performance results is that they are generally prepared with the benefit of hindsight. In addition, hypothetical trading does not involve financial risk, and no hypothetical trading record can completely account for the impact of financial risk of actual trading. for example, the ability to withstand losses or to adhere to a particular trading program in spite of trading losses are material points which can also adversely affect actual trading results. There are numerous other factors related to the markets in general or to the implementation of any specific trading program which cannot be fully accounted for in the preparation of hypothetical performance results and all which can adversely affect trading results.

Testimonial Disclosure: Testimonials appearing on this website may not be representative of other clients or customers and is not a guarantee of future performance or success.