
Insiders still doing the second most bullish thing

Key points
- Corporate insiders have pared their buying in recent months
- However, a spate of insider buying often precedes a bullish period of one to three years for the index or sector involved
- More importantly, for now, insider selling in many key sectors remains significantly low (i.e., insiders are standing pat, waiting for their investment to pay off)
The current state of affairs
Corporate insider buying among Nasdaq 100 constituent companies and the technology sector peaked in mid-to-late 2022. The charts below display the Corporate Insider Buy/Sell Ratio for companies comprising the Nasdaq 100 index (NDX) and the SPDR Technology Sector ETF (XLK) respectively.
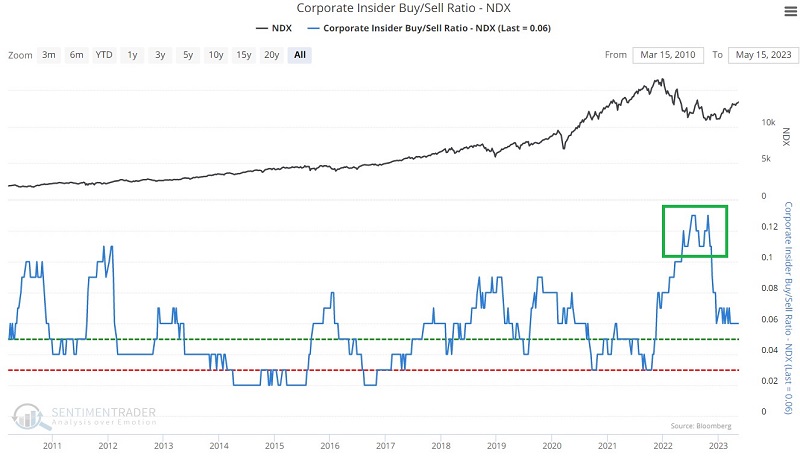
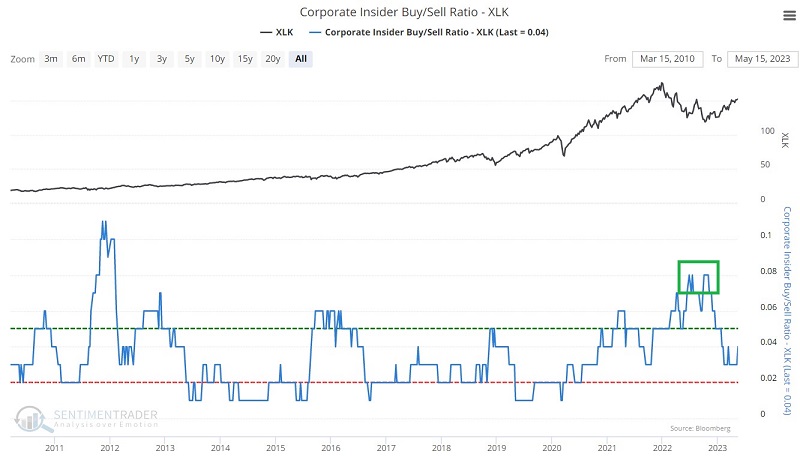
As you can see, buying far outpaced selling in June and October of 2022 as corporate insiders sensed a buying opportunity. Since then, the Buy/Sell ratios for both have fallen off, leading some pundits to fret loudly about "a lack of insider bullishness." History suggests that this line of thinking is unfounded.
Historically, when corporate insiders buy en masse - whether among a broad index like the Nasdaq 100 or within a given sector - they tend to be right over a one to three-year time frame. Thus the recent drop-off in insider bullishness does not negate the earlier bullishness (unless insider selling picks up significantly in the meantime) and means that insiders have "loaded up" on shares (presumably based on their inside knowledge of soon-to-improve fundamentals) and are now waiting for the investment to pay off.
The second most bullish thing insiders can do
The single most bullish thing insiders can do is engage in broad-based open market buying. Like everyone else, corporate insiders only buy stock shares in the open market with their money when they expect share prices to rise. Given their unique access to inside information, spikes in insider buying are a clear sign that they expect business to be good. While they are not infallible (most notably, they are sometimes "early to the party"), they are almost invariably proven correct over one to three years after a spike in buying.
The second most bullish thing insiders can do is not to sell their shares in the face of an advance. This suggests that they have even higher expectations. Several indexes and sectors are presently experiencing a significant level of "not selling."
Let's start with the broadest measure possible - our Corporate Insider Sells indicator. This shows the total number of corporate insiders of S&P 500 companies that have sold shares on the open market during the past six months. The chart below highlights with a red dot those dates when our Corporate Insider Sells - SPX indicator has crossed below 1,800, and the table summarizes the results.
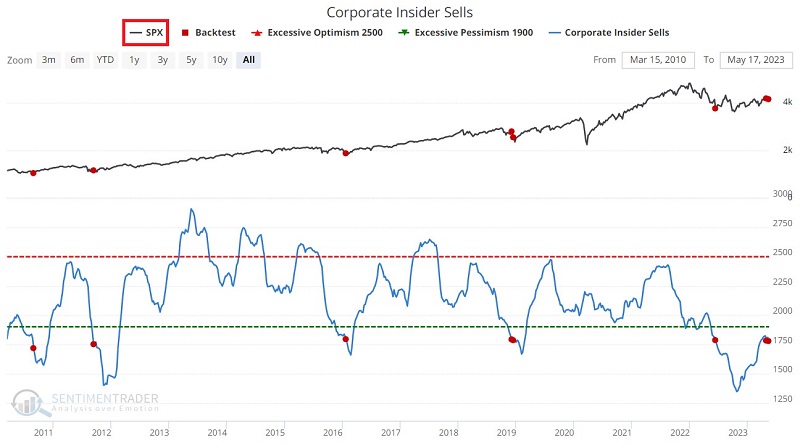
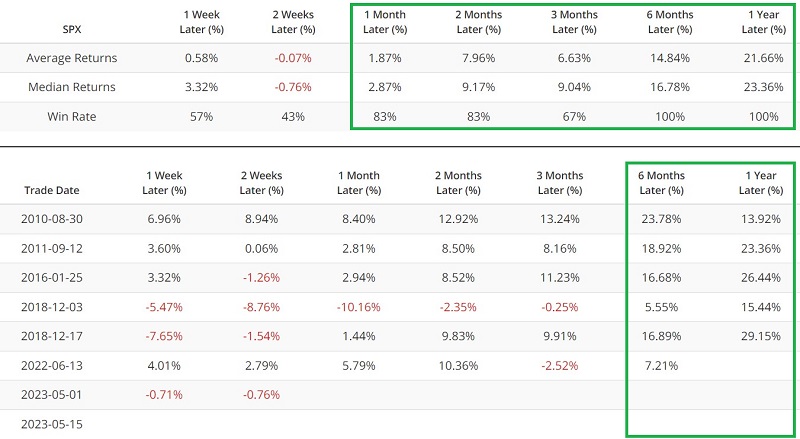
Yes, buying has slowed. But insiders - for now - appear to be in no hurry to unload their company's shares.
A closer look at two sectors
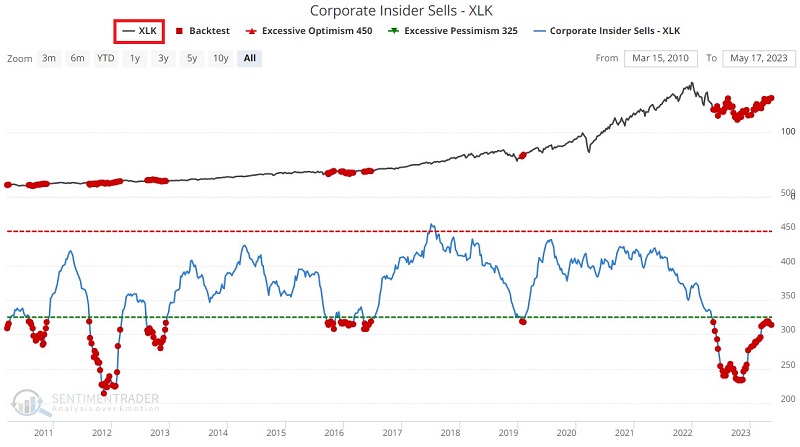
Now let's focus on two sectors of note - technology and materials. Our Corporate Insider Sells - XLK indicator shows the total number of corporate insiders of companies covered by the Technology Select SPDR ETF (ticker XLK) that have sold shares on the open market during the past six months.
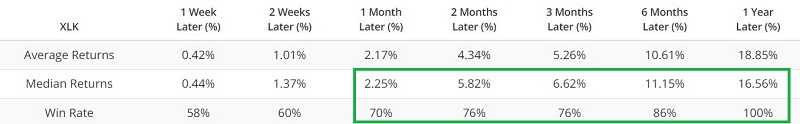
The chart and table below display all weeks when this indicator was below 320 and summarizes XLK's subsequent performance.
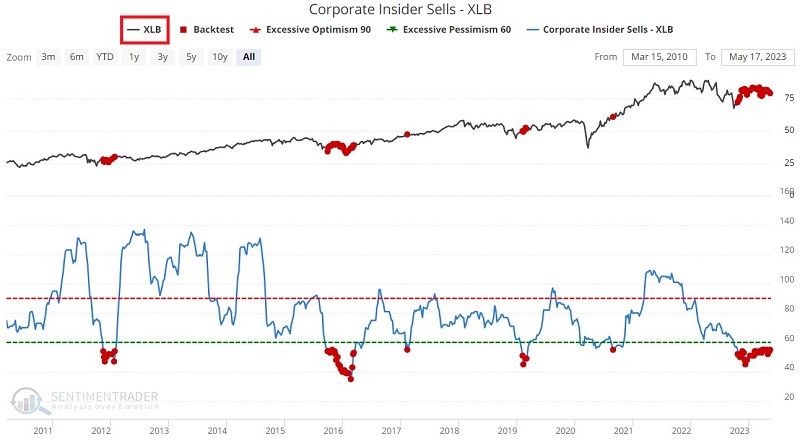
Our Corporate Insider Sells - XLB indicator shows the total number of corporate insiders of companies covered by the Materials Select SPDR ETF (ticker XLB) that have sold shares on the open market during the past six months.
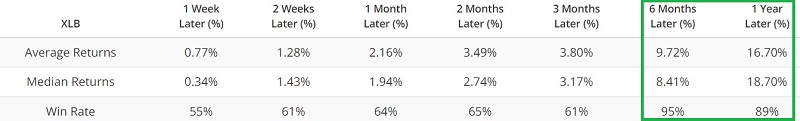
The chart and table below display all weeks when this indicator was below 56 and summarizes XLB's subsequent performance.
What the research tells us…
Like many indicators, corporate insider buying and selling is typically best used not as a standalone buy or sell signal but as part of a broader weight of the evidence approach. And while a well-to-do corporate executive may be able to weather the storm while waiting for a long-term investment in their own shares to pay off, a less well-capitalized trader still needs to be mindful of capital allocation and risk control considerations. Those caveats aside, corporate insiders still appear steadfastly bullish in specific market segments. Given their track record, paying attention may be a good idea.