Products
SentimenTrader Trading Tools
‍
Backtest Engine
My Trading Toolkit
Correlation Analysis
Seasonality
Indicators & Data API
‍
Proprietary Indicators & Charts
Market Data API
Strategies & Scanner
‍
50+ Trading Strategies
Smart Stock Scanner
Research Reports
‍
Research Solutions
Reports Library
Free Resources
Simple Backtest Calculator
Simple Seasonality Calculator
The Kelly Criterion Calculator
Sentiment Geo Map
Public Research Reports
Education
Sentiment Indicators
Technical Indicators
Pricing
Company
About
In the News
Testimonials
Client Success Stories
Contact
Log inLoginSign up
< BACK TO ALL REPORTS

Insiders Buy; A Selling Climax; Small Traders Panic

Jason Goepfert
2018-11-03
null

The weekly indicators that just came out show some interesting extremes.

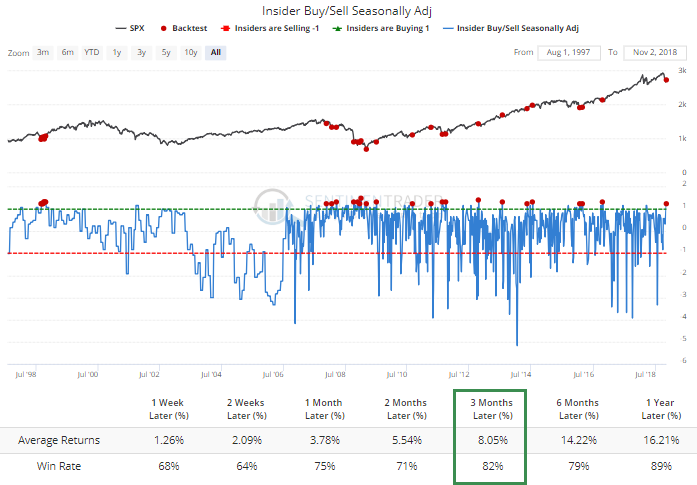
Corporate insiders picked up their buying interest, now that an increasing number of companies are outside of their restriction window during earnings season. This isn't my favorite indicator, especially when it shows selling (it's too inconsistent) but buying interest among insiders is more reliable. When it happens to the degree it did this week, it's been a good sign.

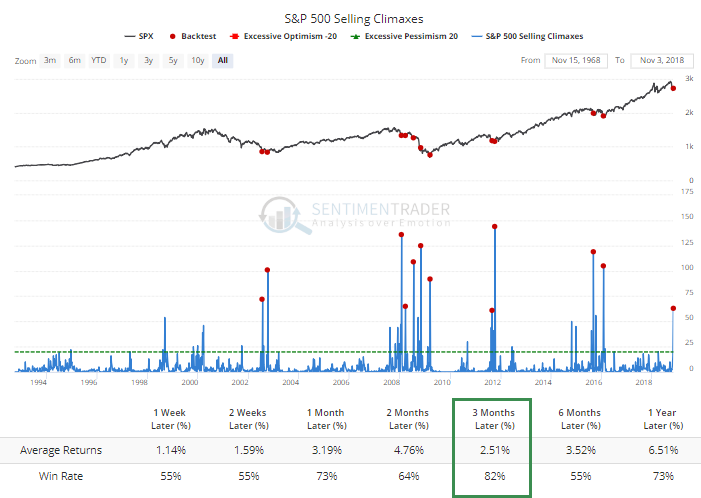
They picked a decent week to pick up their buying, at least earlier in the week. The buying pressure that started midweek was enough to trigger a large number of selling climaxes among S&P 500 stocks. A selling climax occurs when a stock trades down to a 52-week low, then reverses enough to close up for the week. Last week, there were more than 60 stocks in the S&P that triggered the pattern, the most since January 2106.

According to the Backtest Engine, more than 60 selling climaxes in a single week led to some consistent rebounds over the next few months.

If stocks hadn't reversed during the week, it's kind of scary to think about just how many protective puts the smallest of options traders would have bought. As it stands, they spent 25% of their options volume on buying puts, the most since February 2016 and tied for 3rd most since the end of the financial crisis.

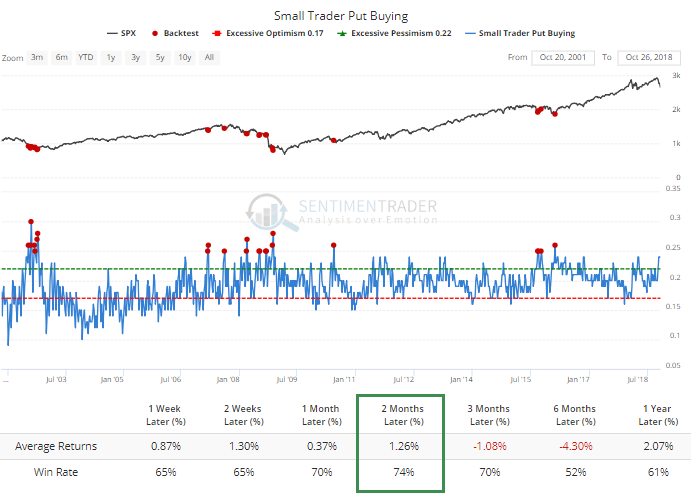
In 2008, their pessimism was warranted right before the big collapse in October, but other than that, it paid to fade their scramble for protection.

A lot of what we've seen in the past two weeks have strongly suggested at least a bear market bounce over the next 2-12 weeks, and those indications continue to pile up. There are definite concerns longer-term given the break in momentum, but we've seen time and again that the types of readings that have been recorded lately consistently tend to lead to multi-week relief even during bear market environments.

Sorry, you don't have access to this report

Upgrade your subscription plan to get access
Go to Dasboard
PRODUCTS
SentimenTrader
Trading Tools
Indicators & Data API
‍
Strategies & Scanner
‍
Research Reports
FREE
RESOUrCES
Simple Backtest
Calculator
Simple Seasonality
Calculator
The Kelly Criterion
Calculator
Sentiment Geo Map
‍
Public Research Reports
‍
Education
Sentiment Indicators
‍
Technical Indicators
‍
Pricing
Bundle pricing
‍
FAQ
‍
Announcements
‍
COMPANY
‍
About
‍
In the News
‍
Testimonials
‍
Client Success Stories
CONTACT
‍
General Inquiries
‍
Media Inquiries
‍
Financial Professionals Inquiries
‍
© 2025 Sundial Capital Research Inc. All rights reserved.
Setsail Marketing
TermsPrivacyAffiliate Program
Risk Disclosure: Futures and forex trading contains substantial risk and is not for every investor. An investor could potentially lose all or more than the initial investment. Risk capital is money that can be lost without jeopardizing ones’ financial security or life style. Only risk capital should be used for trading and only those with sufficient risk capital should consider trading. Past performance is not necessarily indicative of future results.

Hypothetical Performance Disclosure: Hypothetical performance results have many inherent limitations, some of which are described below. No representation is being made that any account will or is likely to achieve profits or losses similar to those shown; in fact, there are frequently sharp differences between hypothetical performance results and the actual results subsequently achieved by any particular trading program. One of the limitations of hypothetical performance results is that they are generally prepared with the benefit of hindsight. In addition, hypothetical trading does not involve financial risk, and no hypothetical trading record can completely account for the impact of financial risk of actual trading. for example, the ability to withstand losses or to adhere to a particular trading program in spite of trading losses are material points which can also adversely affect actual trading results. There are numerous other factors related to the markets in general or to the implementation of any specific trading program which cannot be fully accounted for in the preparation of hypothetical performance results and all which can adversely affect trading results.

Testimonial Disclosure: Testimonials appearing on this website may not be representative of other clients or customers and is not a guarantee of future performance or success.