Products
SentimenTrader Trading Tools
‍
Backtest Engine
My Trading Toolkit
Correlation Analysis
Seasonality
Indicators & Data API
‍
Proprietary Indicators & Charts
Market Data API
Strategies & Scanner
‍
50+ Trading Strategies
Smart Stock Scanner
Research Reports
‍
Research Solutions
Reports Library
Free Resources
Simple Backtest Calculator
Simple Seasonality Calculator
The Kelly Criterion Calculator
Sentiment Geo Map
Public Research Reports
Education
Sentiment Indicators
Technical Indicators
Pricing
Company
About
In the News
Testimonials
Client Success Stories
Contact
Log inLoginSign up
< BACK TO ALL REPORTS

Insiders are bullish Materials...and Seasonals will soon align

Jay Kaeppel
2025-10-02
The Materials sector bounced significantly off its April 2025 low, but has been trending sideways for several months. Fortunately, corporate insider activity has been quite favorable recently. Likewise, component correlation and seasonality suggest a bullish opportunity ahead.

Key points

  • The S&P 500 Materials sector bounced sharply off its April 2025 low but has struggled since early July
  • Corporate insider activity in the materials sector is flashing some very favorable signals
  • Likewise, this sector will soon enter a most favorable seasonal period

Materials sector insider activity remains bullish despite a strong rally

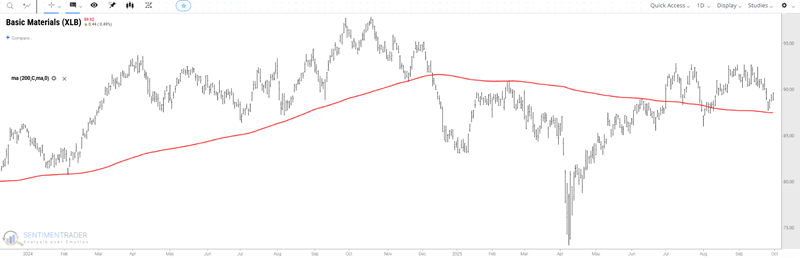
The chart below shows that the Materials Select Sector SPDR Fund (XLB) has rebounded significantly off its April 2025 low and re-established an uptrend above its 200-day moving average. XLB recently retested the 200-day moving average and bounced off of it.

Although XLB has already rallied 25%, corporate sector insiders have only recently started to exhibit some bullish activity. The chart below highlights all weeks when the Corporate Insider Buy/Sell Ratio-XLB indicator was above 0.35. 

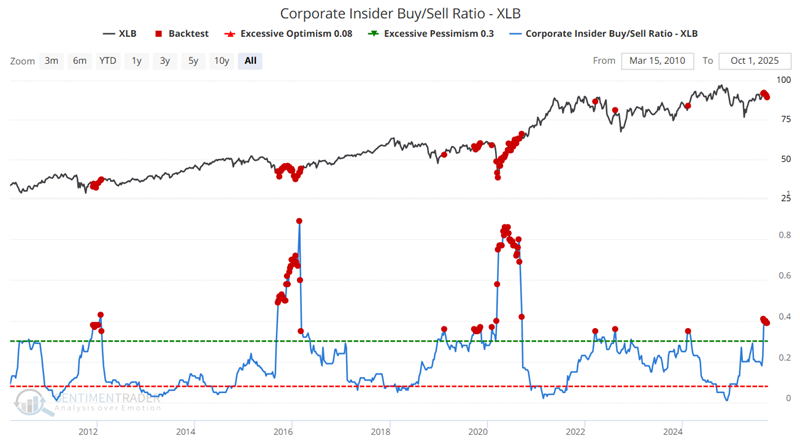
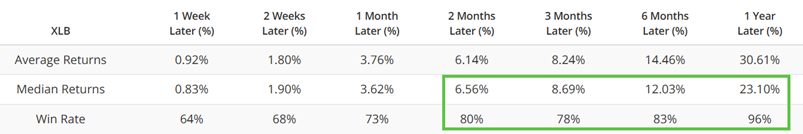
The table below summarizes subsequent XLB performance following the dates highlighted in the chart above.

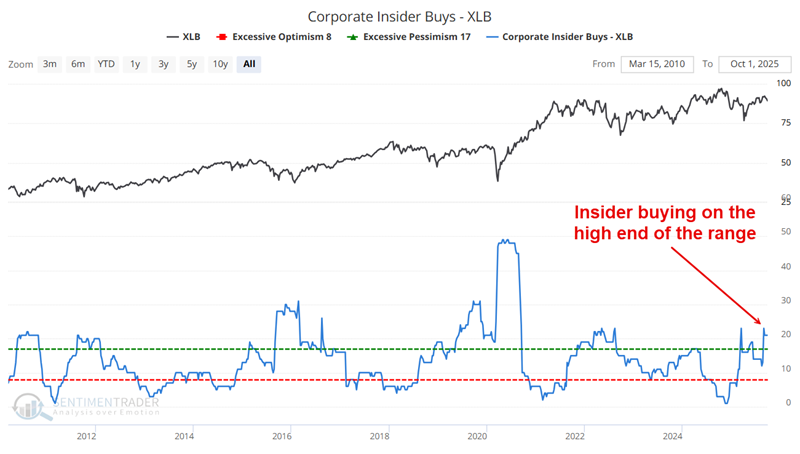
Insider buying is presently in bullish territory as seen below.

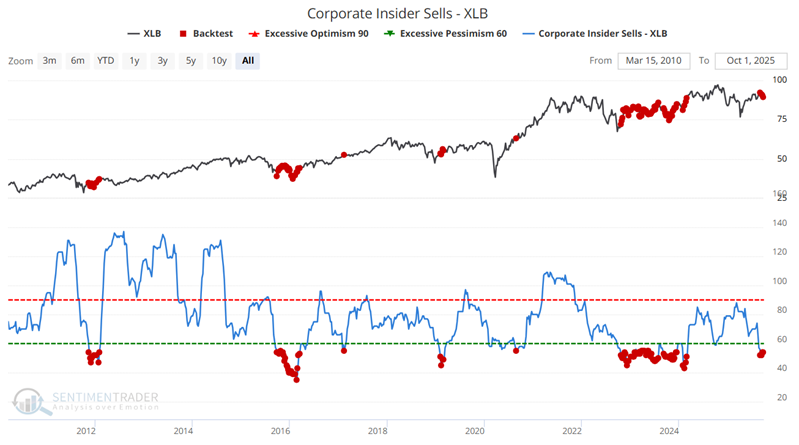
Still, the most notable aspect of recent activity is the plunge in sector insider selling. The chart below highlights all weeks when our Corporate Insider Sells - XLB indicator was below 56. Historically, this has been a good time to accumulate shares in this sector. The most recent signal occurred in late September.

The table below summarizes subsequent XLB performance.

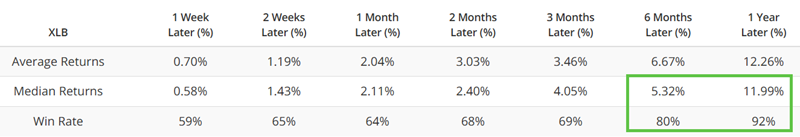
The good news is that recent insider activity strongly suggests higher prices for stocks in this sector over the coming twelve months. 

Component correlation is another favorable factor for Materials

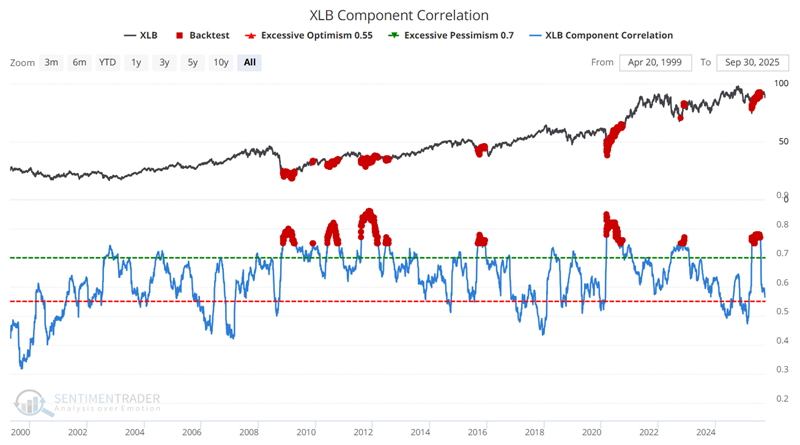
Our component correlation indicator measures the degree to which the sector index component stocks trade similarly. Typically, it is favorable when there is a high degree of correlation. The chart below highlights all dates when the XLB Component Correlation indicator was above 0.75.

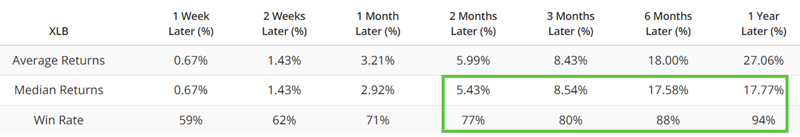
The table below summarizes XLB performance following the dates highlighted in the chart above. Most notable is the high Win Rates two months and out. This dovetails nicely with the insider action highlighted above.


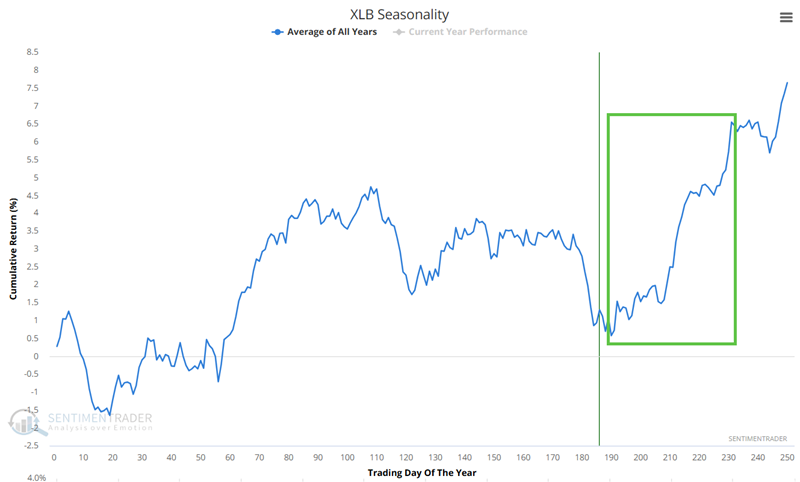
Seasonality will soon be a favorable factor

The chart below displays the Annual Seasonal Trend for ticker XLB. A strong seasonal period will begin soon, extending from Trading Day of Year (TDY) #190 through #231. For 2025, this period extends from the close on October 6th through December 3rd.,

The chart below shows the hypothetical growth of $1 invested in ticker XLB only during this period every year since 1999.

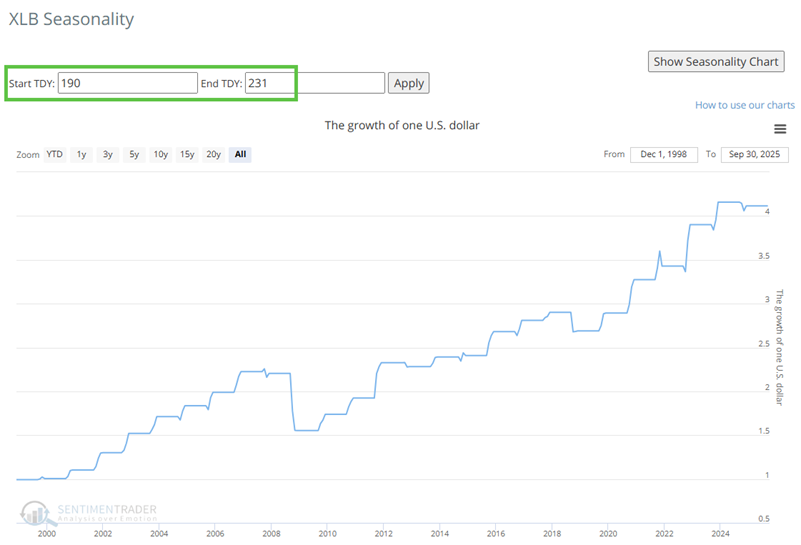
As always, seasonality is merely an average of the past and not a roadmap for the future. Nevertheless, it will soon rank as a favorable factor for the materials sector.

What the research tells us...

Corporate insiders are typically not precision market timers and often buy in too early or too late relative to a bottom in price. Nevertheless, they are rarely wrong over a one-to-three-year period when they act en masse. The recent insider activity in the materials sector, combined with the recent high correlation among materials sector stocks and an impending favorable seasonal period, suggests that investors give this sector the benefit of the bullish doubt in the year ahead. 

PRODUCTS
SentimenTrader
Trading Tools
Indicators & Data API
‍
Strategies & Scanner
‍
Research Reports
FREE
RESOUrCES
Simple Backtest
Calculator
Simple Seasonality
Calculator
The Kelly Criterion
Calculator
Sentiment Geo Map
‍
Public Research Reports
‍
Education
Sentiment Indicators
‍
Technical Indicators
‍
Pricing
Bundle pricing
‍
FAQ
‍
Announcements
‍
COMPANY
‍
About
‍
In the News
‍
Testimonials
‍
Client Success Stories
CONTACT
‍
General Inquiries
‍
Media Inquiries
‍
Financial Professionals Inquiries
‍
© 2025 Sundial Capital Research Inc. All rights reserved.
Setsail Marketing
TermsPrivacyAffiliate Program
Risk Disclosure: Futures and forex trading contains substantial risk and is not for every investor. An investor could potentially lose all or more than the initial investment. Risk capital is money that can be lost without jeopardizing ones’ financial security or life style. Only risk capital should be used for trading and only those with sufficient risk capital should consider trading. Past performance is not necessarily indicative of future results.

Hypothetical Performance Disclosure: Hypothetical performance results have many inherent limitations, some of which are described below. No representation is being made that any account will or is likely to achieve profits or losses similar to those shown; in fact, there are frequently sharp differences between hypothetical performance results and the actual results subsequently achieved by any particular trading program. One of the limitations of hypothetical performance results is that they are generally prepared with the benefit of hindsight. In addition, hypothetical trading does not involve financial risk, and no hypothetical trading record can completely account for the impact of financial risk of actual trading. for example, the ability to withstand losses or to adhere to a particular trading program in spite of trading losses are material points which can also adversely affect actual trading results. There are numerous other factors related to the markets in general or to the implementation of any specific trading program which cannot be fully accounted for in the preparation of hypothetical performance results and all which can adversely affect trading results.

Testimonial Disclosure: Testimonials appearing on this website may not be representative of other clients or customers and is not a guarantee of future performance or success.