
Insider Velocity reveals renewed bullishness among corporate insiders

Key points
- Our Corporate Insider Velocity indicator detects important "under the radar" shifts in corporate insider buying and selling
- Extremes and/or reversals in corporate insider activity often highlight potential opportunities for alert investors
- Several potential opportunities have recently surfaced in the S&P 500 and the industrial, healthcare, and consumer discretionary sectors
Adding Corporate Insider Velocity to the indicator toolbox
The Sentimentrader Corporate Insider Velocity indicator shows the velocity of corporate insider buying versus selling. It takes a 4-week rate of change for insider buys and subtracts a 4-week rate of change for insider sales.
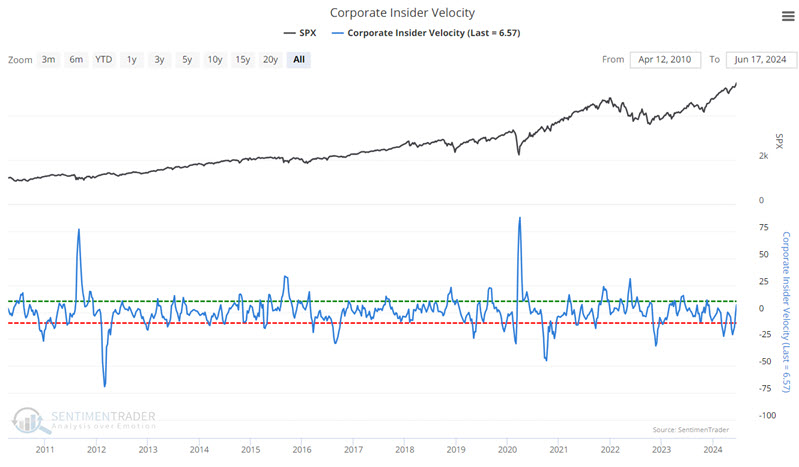
Generally speaking:
- Extremes in insider activity (high or low) have tended to be favorable for the underlying index or sector
- Extreme readings are often "early" and serve more as "alert" than as actual trading signals
- Reversals from extremes are often an excellent time to consider entering a position
- Lastly, signals from this indicator are generally best used in conjunction with other information and not necessarily as a standalone trading model
The S&P 500 Index
The chart below highlights when the Corporate Insider Velocity indicator's 10-week moving average crossed above -10. Note that some signals were early. The most recent signal occurred on 2024-06-03.
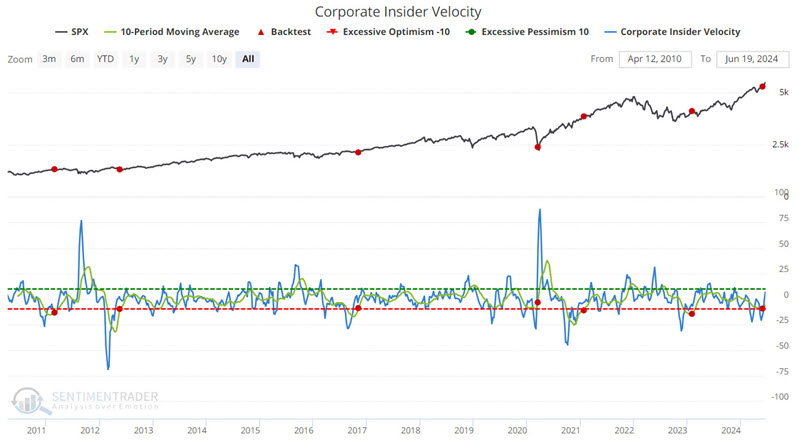
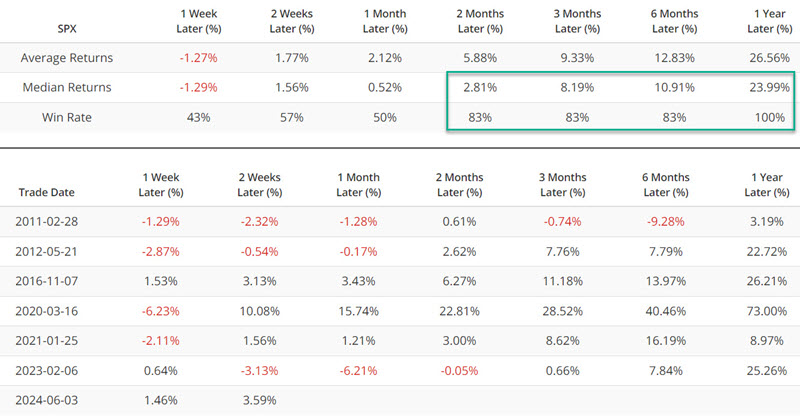
The table below summarizes subsequent SPX performance.
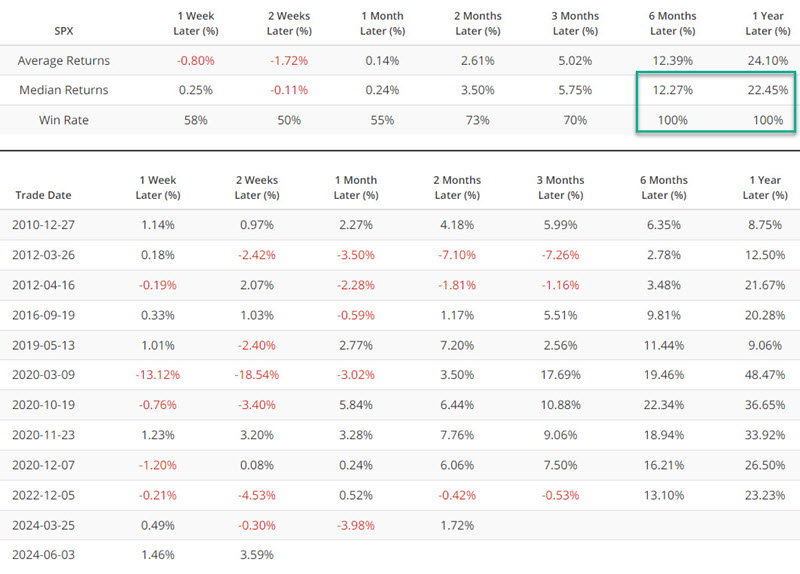
One thing to note is that there is no "one best way" to measure and use corporate insider velocity. The chart below highlights the dates when the Corporate Insider Velocity indicator (with no moving average applied) crossed above -20. The application, signal dates, and performance are "similar but different" from the ones shown above.
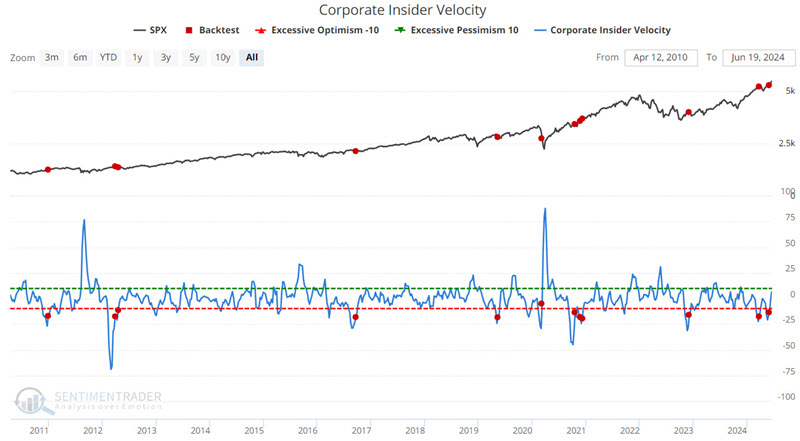
The table below summarizes subsequent S&P 500 performance.
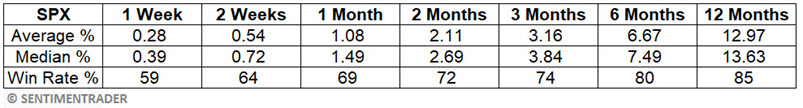
For comparison, the table below displays SPX performance for all dates.
The Industrials sector
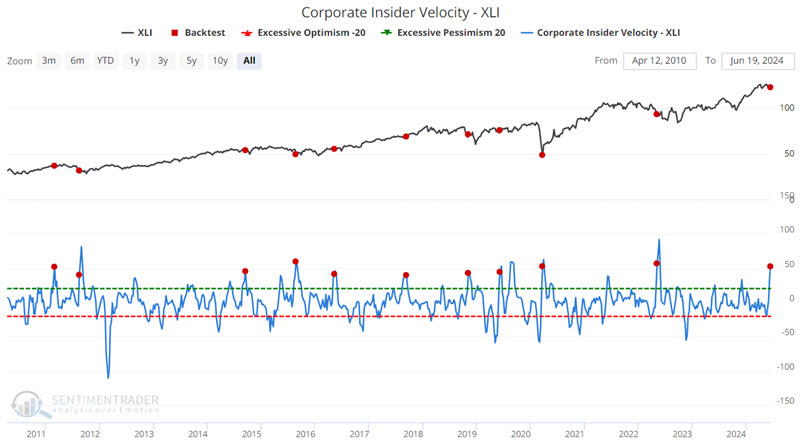
Now, let's focus on the industrial sector and a different approach to using insider velocity. The chart below highlights the dates when the Corporate Insider Velocity-XLI indicator crossed above 40 for the first time in three months. The most recent signal occurred on 2024-06-17. Note that instead of looking for a reversal from a low level (which theoretically highlights a reversal from bearishness to bullishness among insiders), we are simply highlighting a burst in apparent bullishness among insiders.
The table below summarizes subsequent XLI performance. 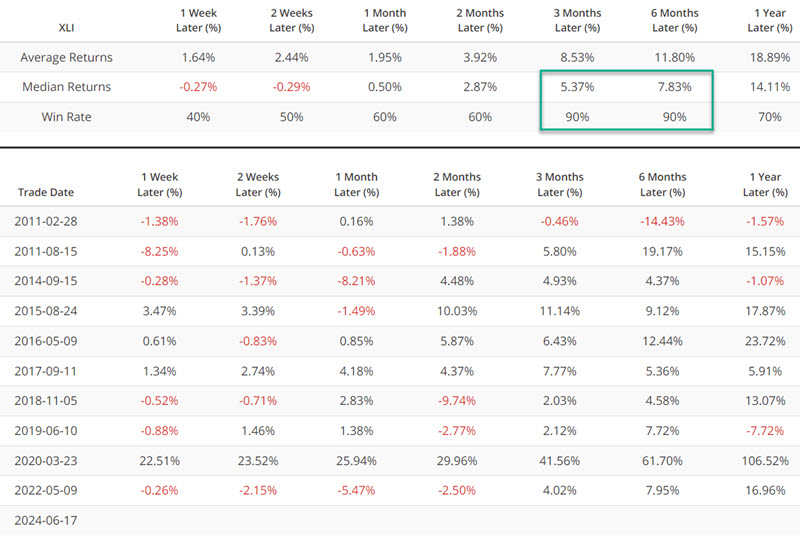
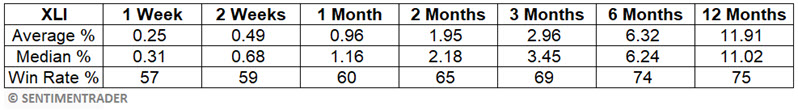
For comparison, the table below displays XLI performance for all dates.
The Healthcare sector
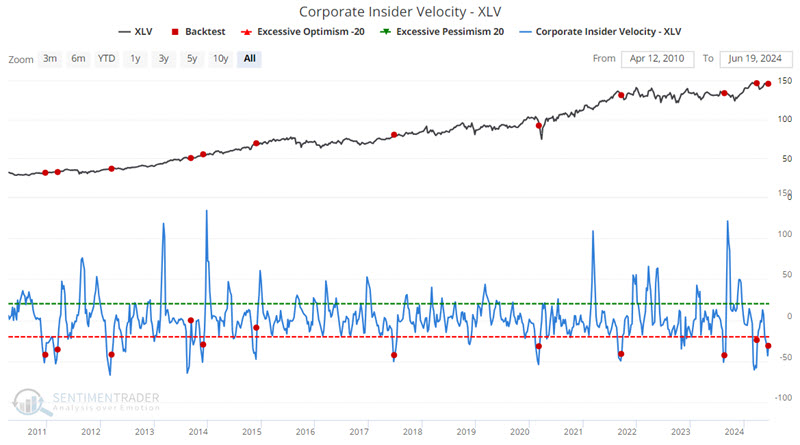
The chart below highlights the dates when the Corporate Insider Velocity-XLV indicator crossed above -43. Note that some signals were early. The most recent signal occurred on 2024-06-17.
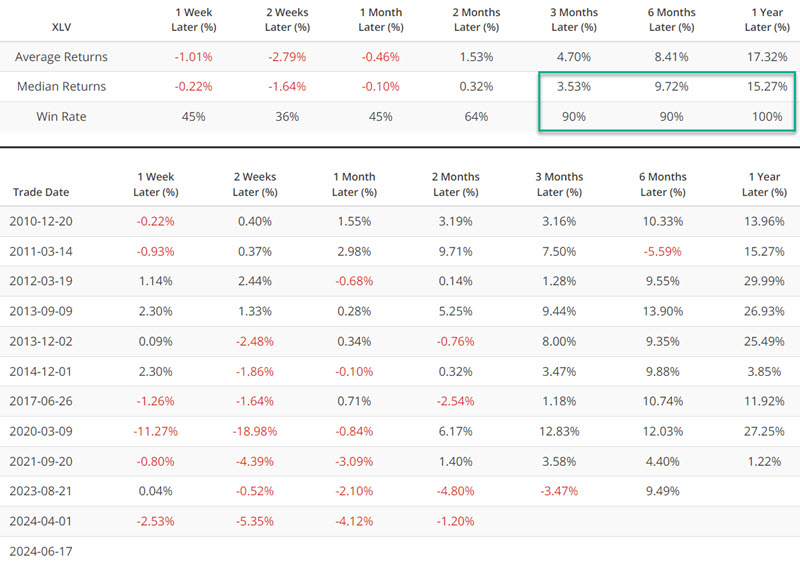
The table below summarizes subsequent XLV performance.
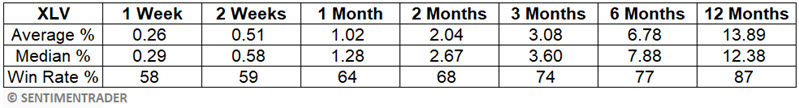
For comparison, the table below displays XLV performance for all dates.
The Consumer Discretionary sector
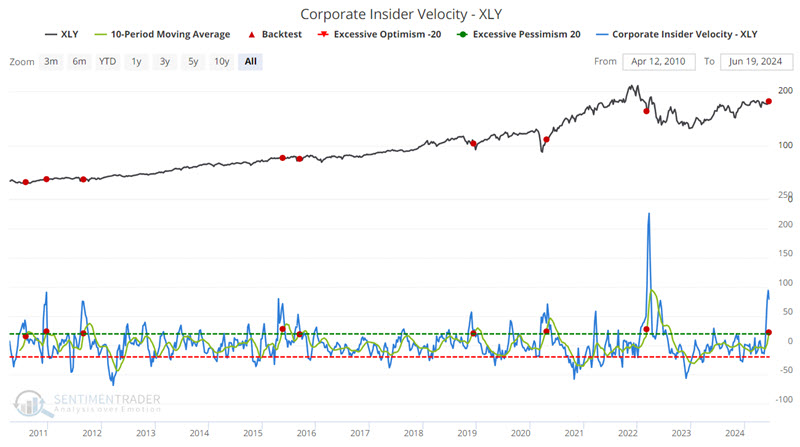
The chart below highlights the dates when the Corporate Insider Velocity-XLY indicator's 10-week moving average crossed above 20. The most recent signal occurred on 2024-06-17.
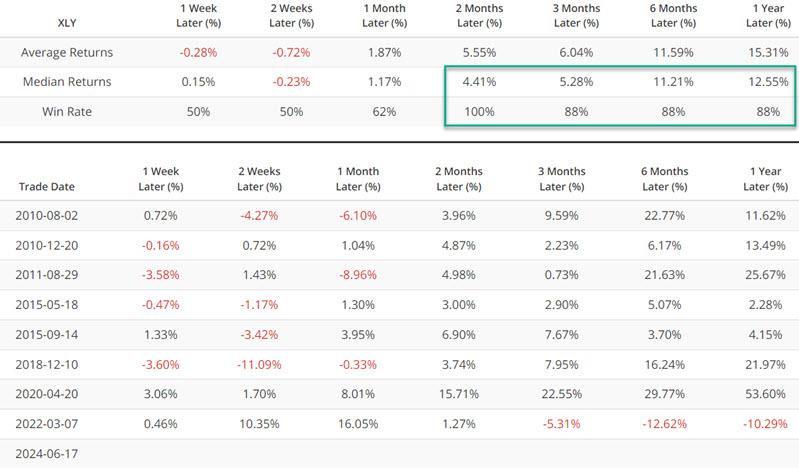
The table below summarizes subsequent XLY performance.
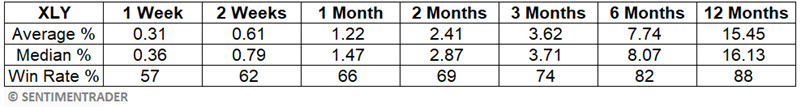
For comparison, the table below displays XLY performance for all dates.
What the research tells us…
Common mistakes that investors make regarding indicators include expecting there to be "one best way" to generate a signal from a given indicator and expecting a given indicator to act as a full-fledged trading system. However, most indicators merely give information regarding only one factor that might affect a given stock, index, or market. Thus, individual indicators are typically best used not as a standalone trade generator but as part of a process. Likewise, investors are always encouraged to experiment with different ways to interpret a given indicator. Our Corporate Insider Velocity indicator sometimes conveys information about extremes and/or reversals in corporate insider activity. As these individuals know their companies' prospects best, it can be beneficial to consider their actions as part of a larger strategy.