
Insider selling down, correlations up in top election cycle sectors

Key points:
- Five sectors tend to perform well during the most favorable ten-month period of the 48-month election cycle
- Insider selling pressure in these sectors has dried up in recent months
- The correlation among stocks in these sectors is high, suggesting indiscriminate selling
The favorable ten-month top five sectors
The most favorable ten-month period within the 48-month election cycle includes October of the mid-term year through July of the pre-election year. As shown last week, the top five sectors for the best ten-month election cycle period are:
- Materials (XLB)
- Technology (XLK)
- Industrials (XLI)
- Consumer Discretionary (XLY)
- Health Care (XLV)
Corporate Insider Sells and Sector Component Correlation
When it comes to corporate insider transactions, heavy insider buying is the best as it shows people committing their own money to buy shares of their own companies. However, another significant event occurs when insider selling dries up.
While not quite the same as plunking down new cash, an absence of selling indicates commitment because insiders are unwilling to part with their current holdings. Low corporate insider selling readings tend to be bullish.
Component correlation measures the degree to which the stocks in a given sector are trending together. Typically, the highest readings occur when a sector declines, and investors start dumping all stocks in the sector regardless of quality. High component correlation readings tend to be bullish for the sector in question.
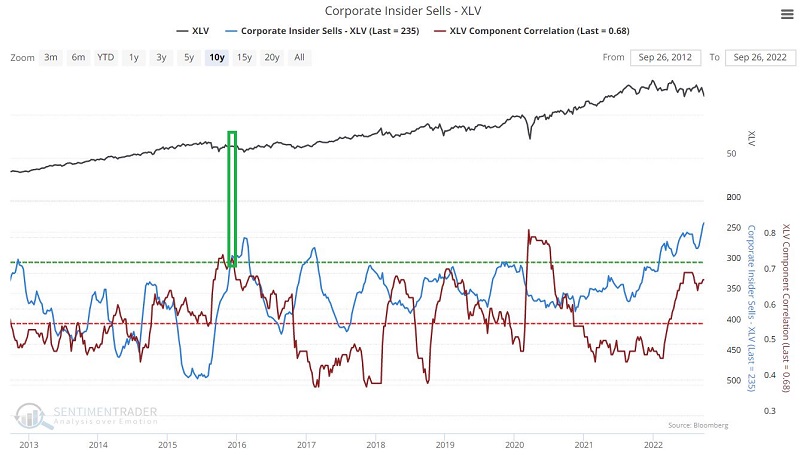
In the charts below, we invert the scale for Corporate Insider Sells so that bullish readings for both indicators appear at the high end of the indicator charts. The green boxes in each chart note those rare occasions when both corporate Insider Sells were low and component correlation was high.
Now let's take a closer look at these indicators for each sector.
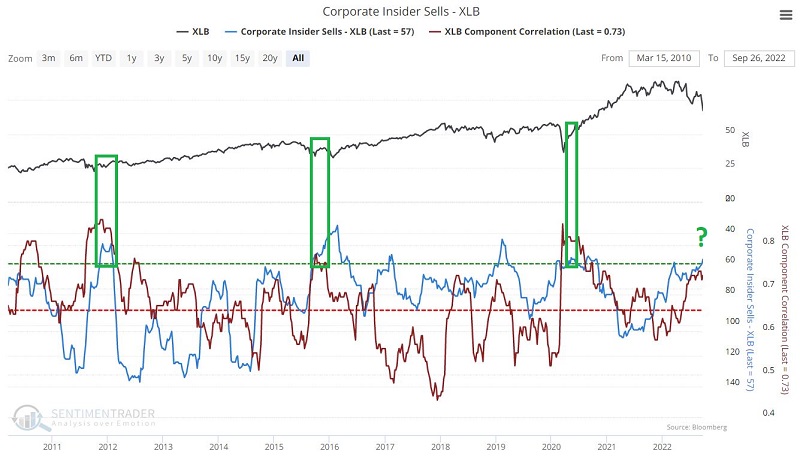
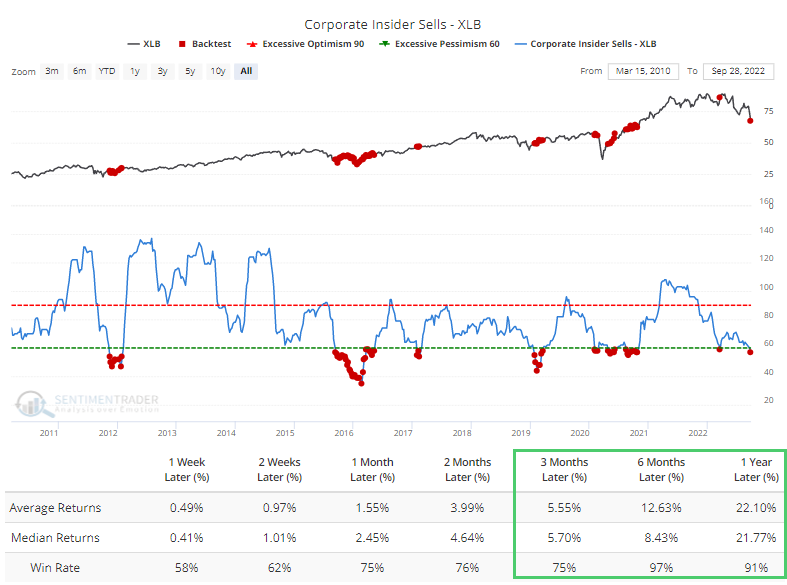
The materials sector (ETF XLB)
The chart and table below display all weeks when Corporate Insider Sells - XLB was below 60.
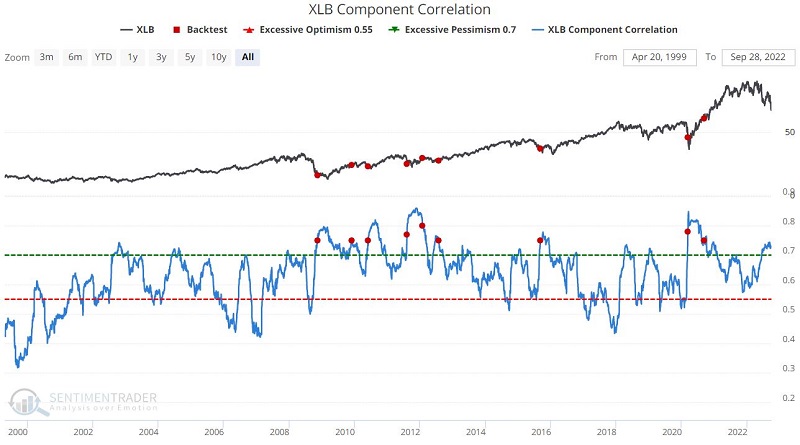
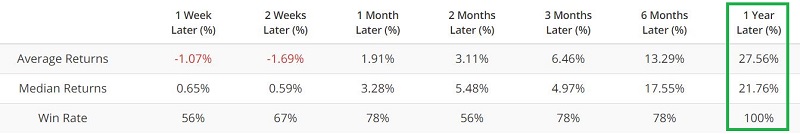
The chart and table below display those times when XLB Component Correlation was above 0.75, excluding 6-month overlapping periods. The latest reading is just under the favorable level of 0.75 at 0.7259.
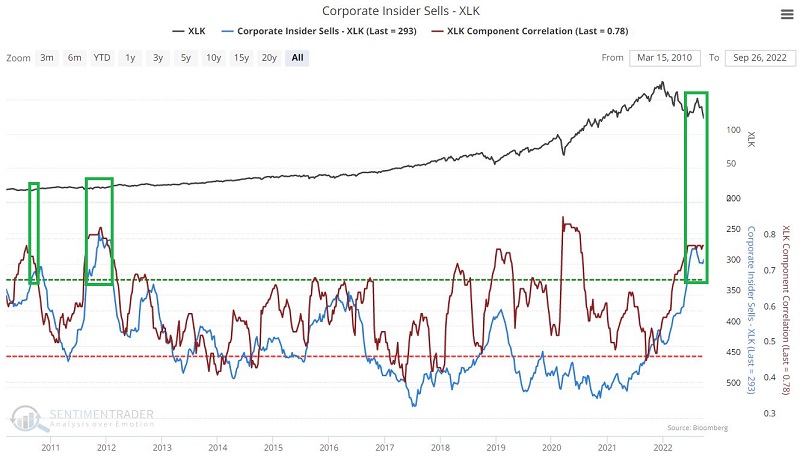
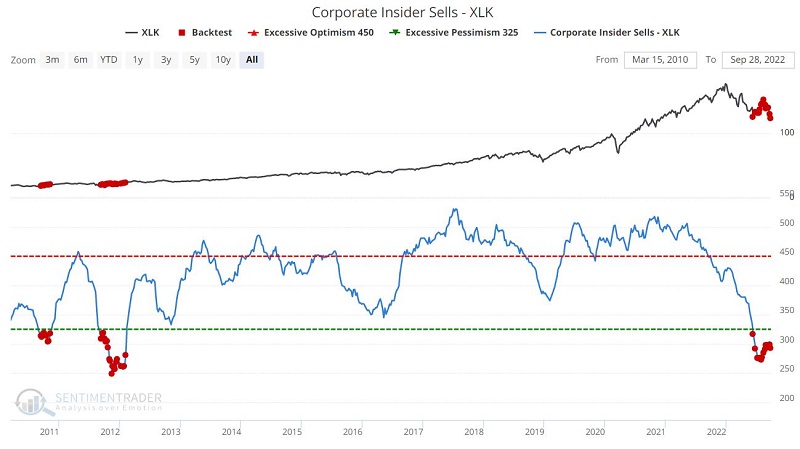
The technology sector (ETF XLK)
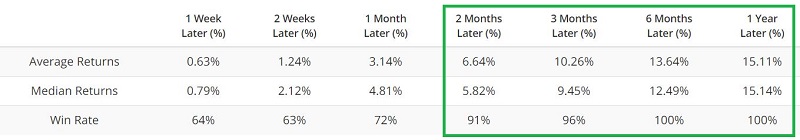
The chart and table below display all weeks when Corporate Insider Sells - XLK was below 320.
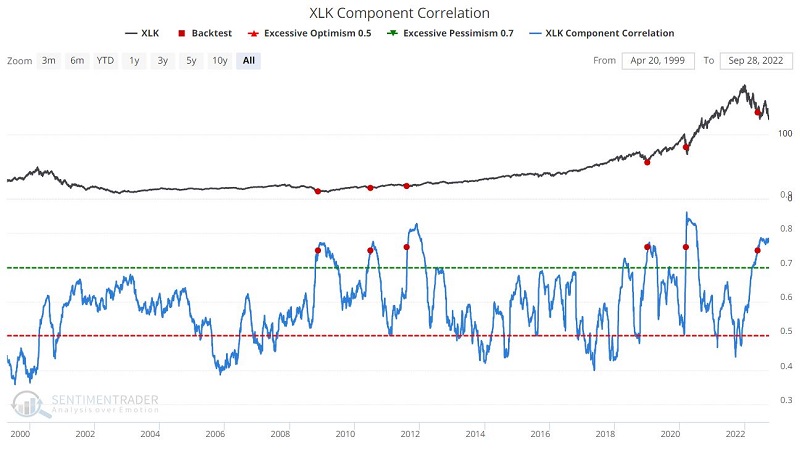
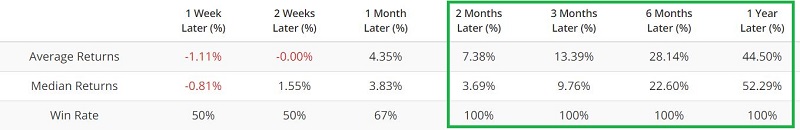
The chart and table below display those times when XLK Component Correlation was above 0.75 for the first time in six months.
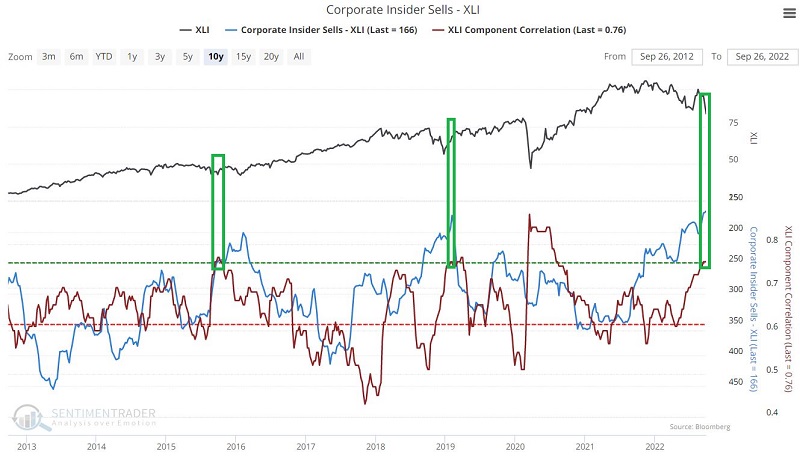
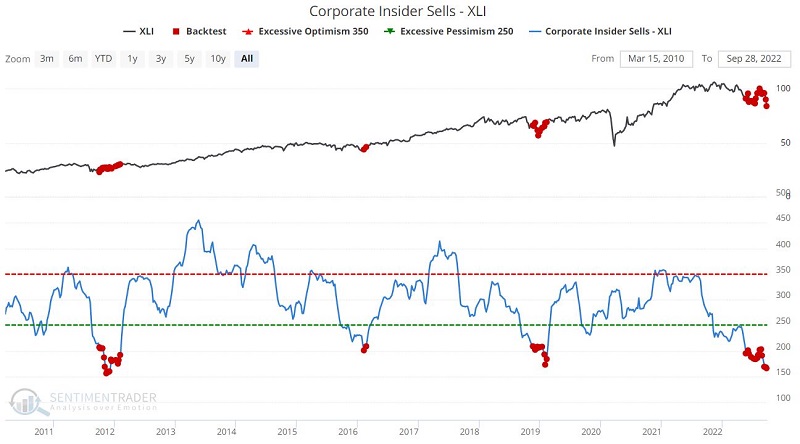
Industrial sector (ETF XLI)
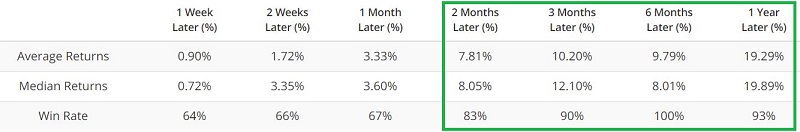
The chart and table below display all weeks when Corporate Insider Sells - XLI was below 210.
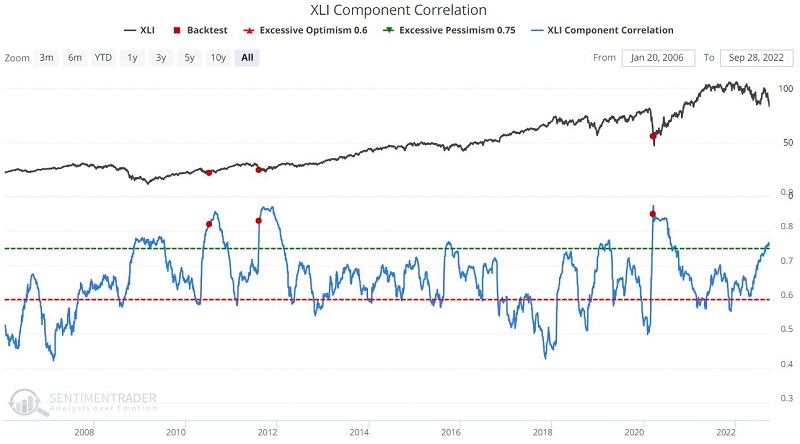
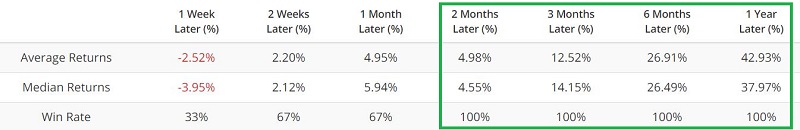
The chart and table below display those times when XLI Component Correlation was above 0.82 for the first time in six months. Note that the latest reading is still under the favorable level of 0.82 at 0.7618.
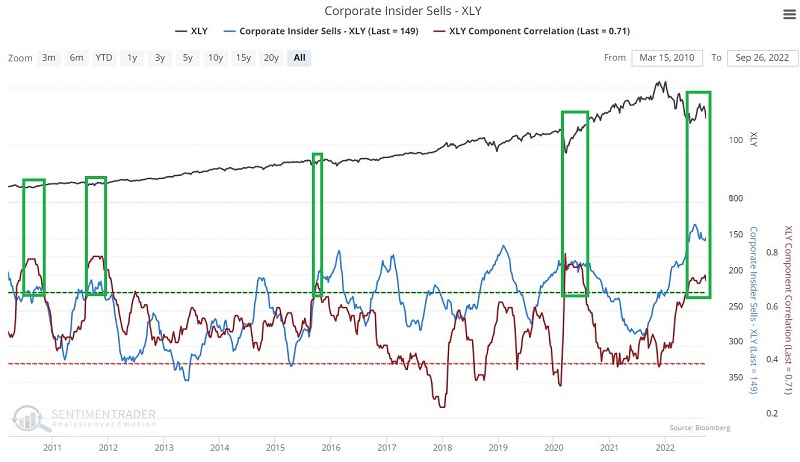
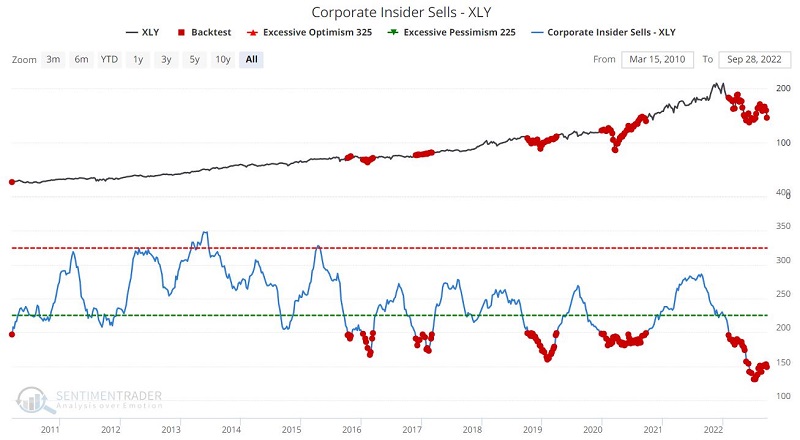
Consumer Discretionary sector (ETF XLY)
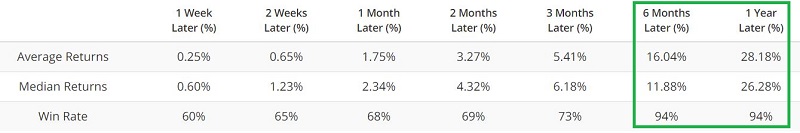
The chart and table below display all weeks when Corporate Insider Sells - XLY was below 200.
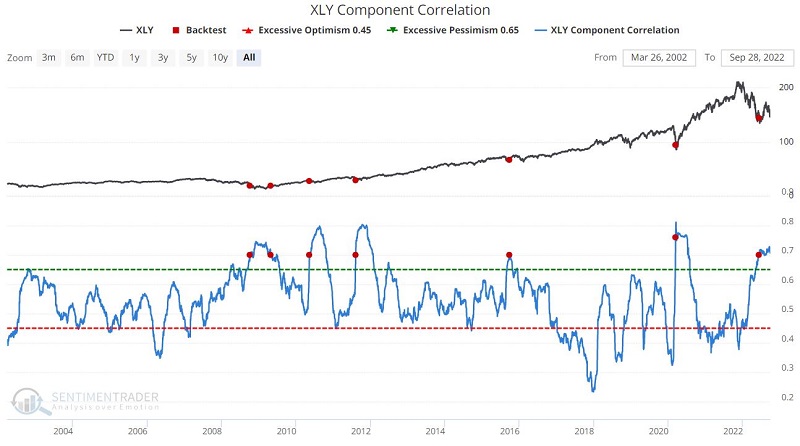
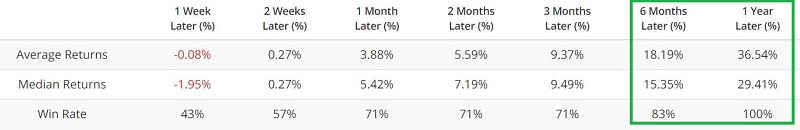
The chart and table below display those times when XLY Component Correlation was above 0.70 for the first time in six months.
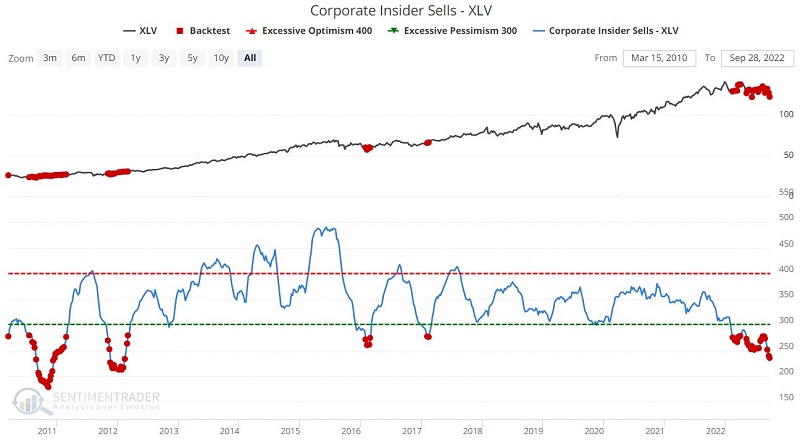
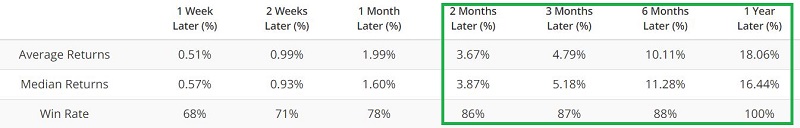
Health Care sector (ETF XLV)
The chart and table below display all weeks when Corporate Insider Sells - XLV was below 280.
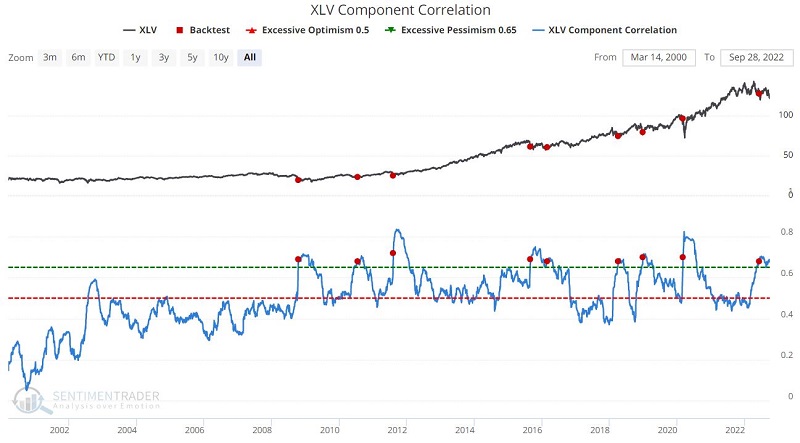
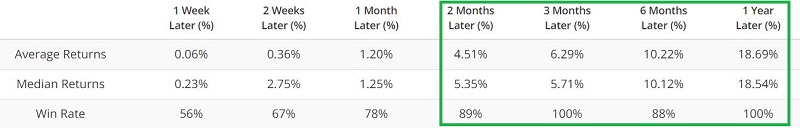
The chart and table below display those times when XLY Component Correlation was above 0.68 for the first time in six months.
What the research tells us…
Let's put macroeconomics and current market trends aside for the moment. The five sectors highlighted above all have three things in common: They have 1) showed consistency in performing well from October of mid-term years through July of pre-election years, 2) recently experienced a sharp drop-off in the level of corporate insider selling, and 3) during recent declines, the majority of the stocks in the sector are being sold regardless of corporate fundamentals. There is no guarantee that any or all of these sectors will perform well in the months ahead. Nevertheless, they all presently enjoy a seemingly favorable setup.