Data &
Technology
Research
Reports
Report Solutions
Reports Library
Actionable
Strategies
Free
Resources
Simple Backtest Calculator
Simple Seasonality Calculator
The Kelly Criterion Calculator
Sentiment Geo Map
Public Research Reports
Free Webinar
Pricing
Company
About
Meet Our Team
In the News
Testimonials
Client Success Stories
Contact
Log inLoginSign up
< BACK TO ALL REPORTS

Insane volatility across countries

Troy Bombardia
2020-03-24
Volatility in equities across the world over the past month has gone through the roof. In many ways this can only be compared to 1929, 1987, 2001-2002, and 2008.

I've looked at volatility from many different angles over the past few weeks, and it has mostly been the same. Volatility is extremely high, which *should* be a bullish sign for equities. But given the extremely rapid pace of this recession+bear market, a lot of historical comparisons have not worked out so far.

The S&P 500's 20 day volatility can only be compared to 2 periods in history: the start of the 1929-1932 bear market, and the 1987 crash.

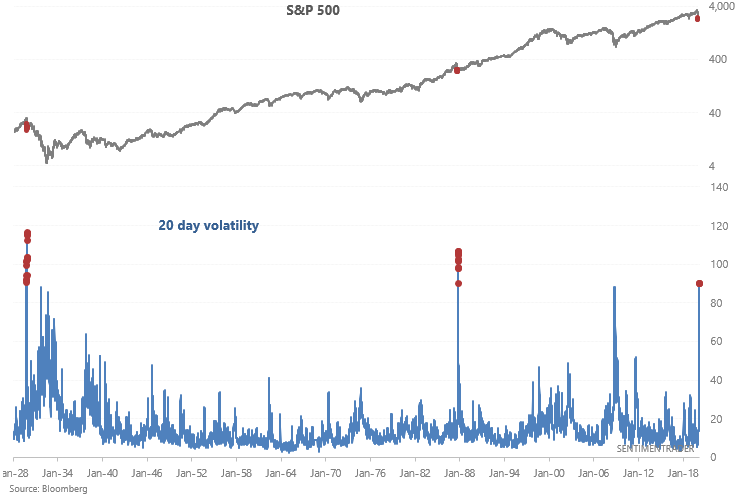
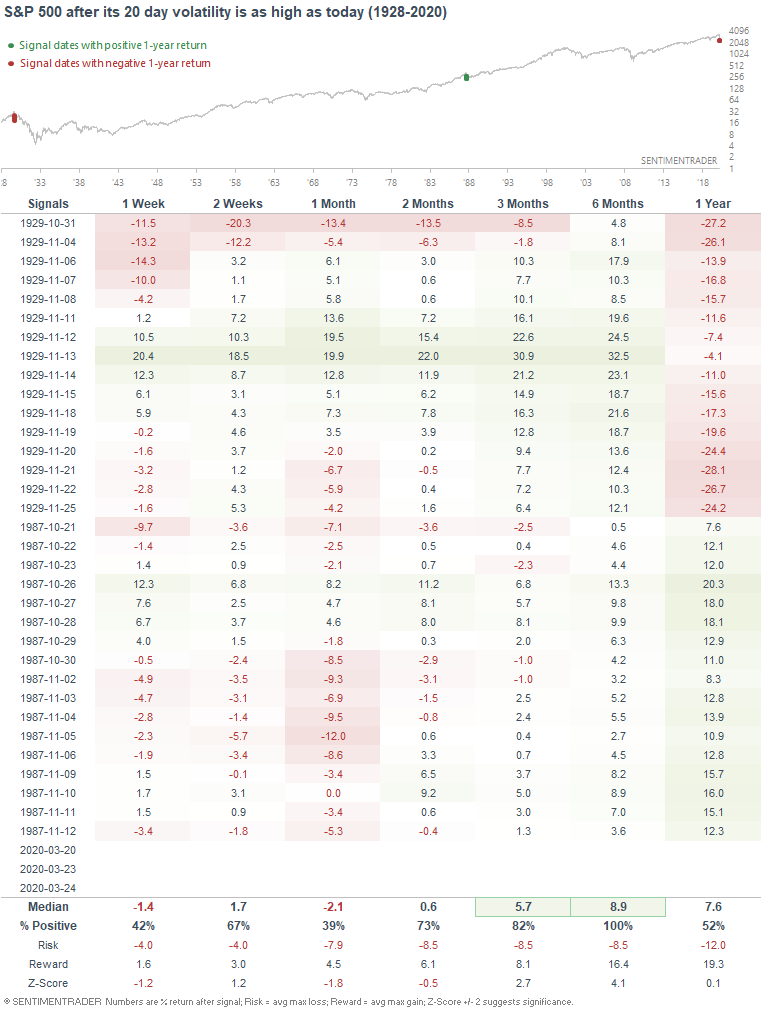
When volatility was this high in the past, the S&P 500 rallied vigorously over the next 3-6 months EVEN if there was lots of short term chop. Once again, there are really only 2 cases: 1929 and 1987.

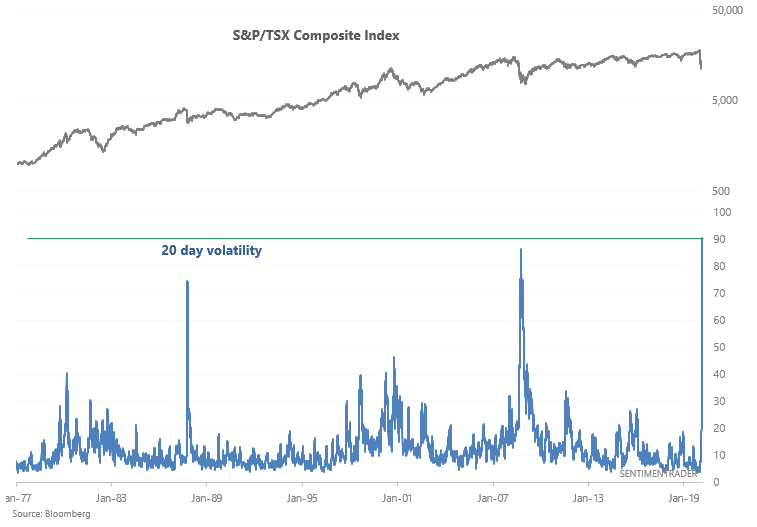
Volatility in other countries' stock market is just as extreme.

For example, volatility in Canada is at its highest reading ever, higher than the 1987 or 2008 crashes. Granted, there is less historical data than in the U.S.:

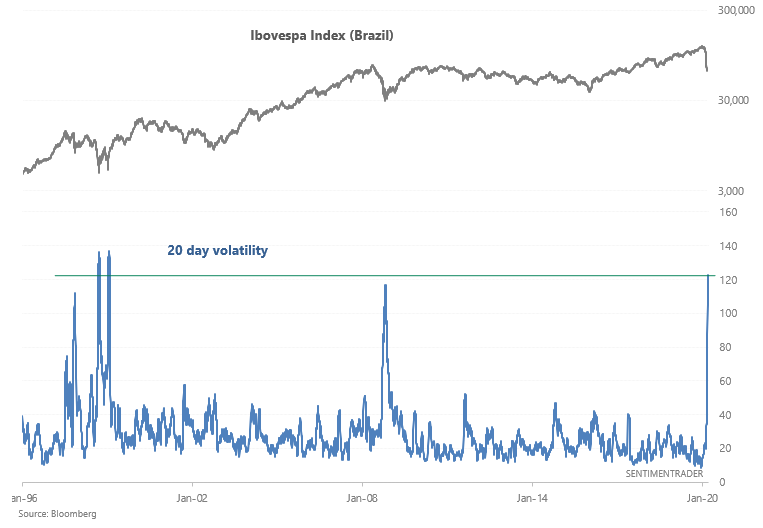
Volatility in Brazil is among the highest ever:

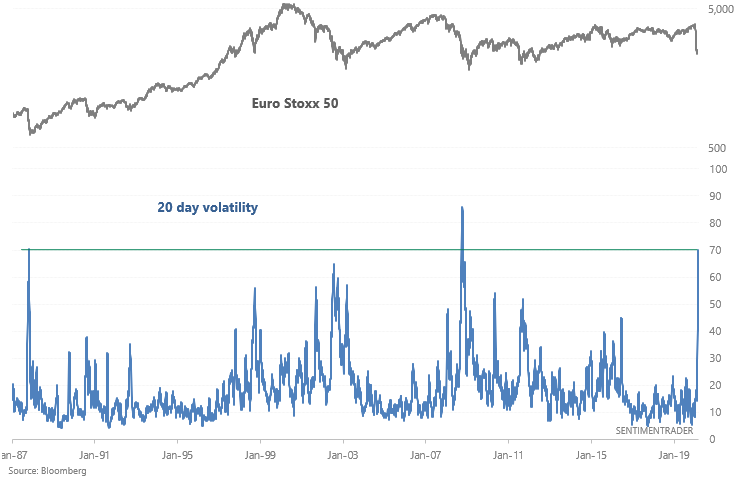
Volatility in Europe can only be compared to that of 2008 and 1987:

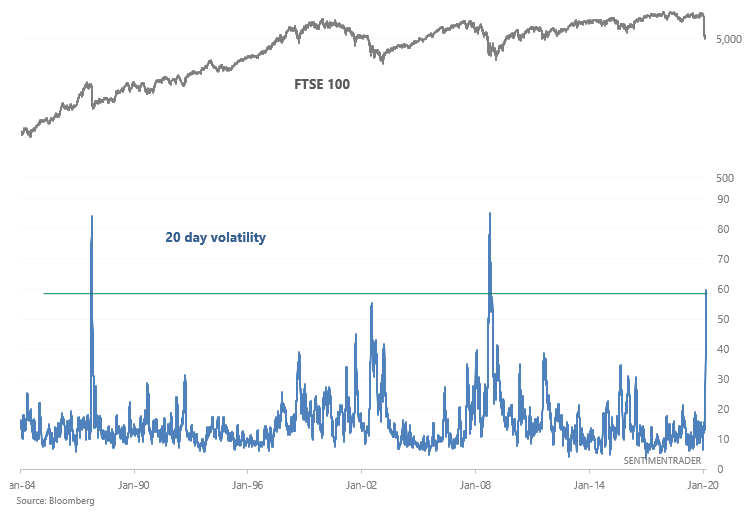
Volatility in the UK can only be compared to 1987 and 2008:
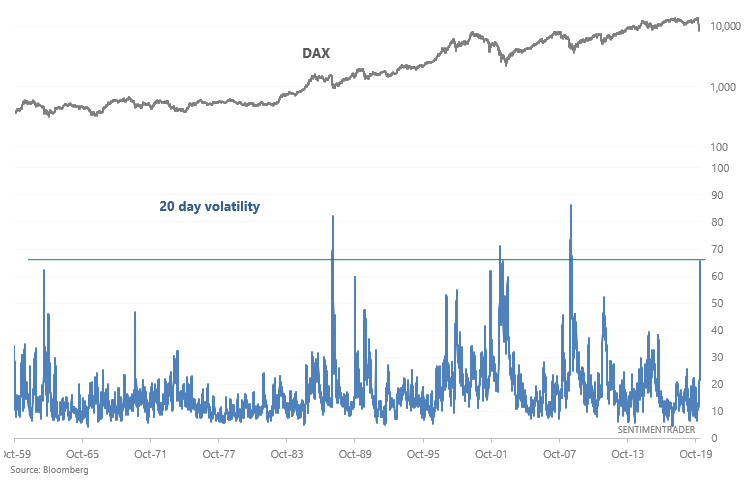
Same in Germany...

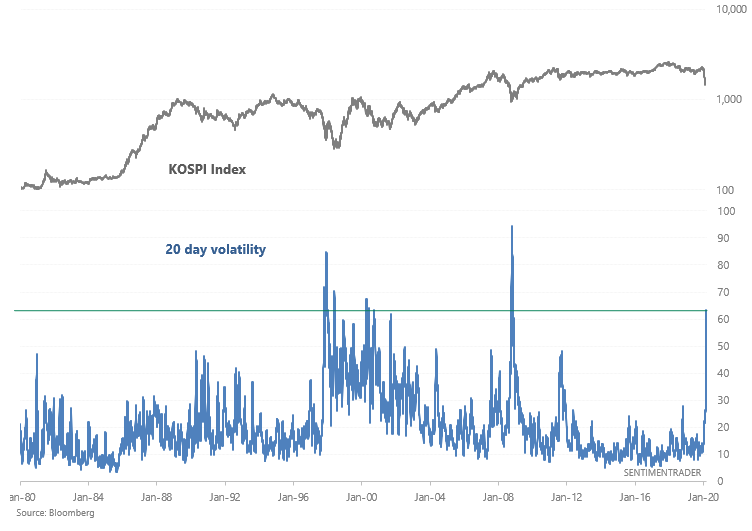
Volatility in South Korea is extreme high:

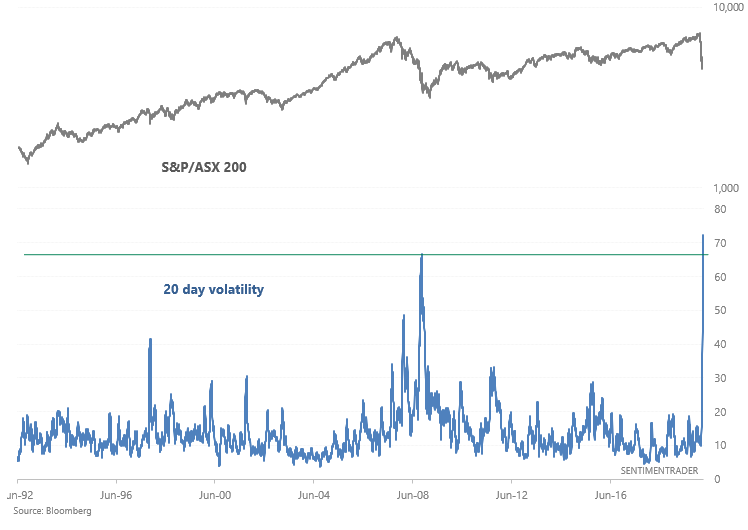
And volatility in Australia is at its highest reading ever, higher than even during 2008:

Overall, a sample size of 2 ("today is just like 1929" or "today is just like 1987") isn't very helpful. The human mind likes to compare today to the past, which gives it a roadmap regarding how to navigate the future. While this works when there's a decently large sample size, sample sizes of n=1 or n=2 are misleading. If you were in 1987 and used a sample size of n=1 ("today is just like 1929"), you would have been crazy bearish. Which clearly was the wrong thing to do, since 1987-1988 turned out to be nothing like 1929-1932.

In the end, extremely high volatility is a medium term bullish sign for stocks. But to think that the next 1-2 years will play out "just like 1929-1932" or "just like 1987-1988" is folly. The future is never just like the past.

Sorry, you don't have access to this report

Upgrade your subscription plan to get access
Go to Dasboard
DATA &
TECHnologies
IndicatorEdge
‍
BackTestEdge
‍
Other Tools
‍
DataEdge API
RESEARCH
reports
Research Solution
‍
Reports Library
‍
actionable
Strategies
Trading Strategies
‍
Smart Stock Scanner
‍
FREE
RESOUrCES
Simple Backtest
Calculator
Simple Seasonality
Calculator
The Kelly Criterion
Calculator
Sentiment Geo Map
‍
Public Research Reports
‍
Free Webinar
COMPANY
‍
About
‍
Meet our Team
‍
In the News
‍
Testimonials
‍
Client Success Stories
Pricing
Bundle pricing
‍
Announcements
‍
FAQ
© 2024 Sundial Capital Research Inc. All rights reserved.
Setsail Marketing
TermsPrivacyAffiliate Program
Risk Disclosure: Futures and forex trading contains substantial risk and is not for every investor. An investor could potentially lose all or more than the initial investment. Risk capital is money that can be lost without jeopardizing ones’ financial security or life style. Only risk capital should be used for trading and only those with sufficient risk capital should consider trading. Past performance is not necessarily indicative of future results.

Hypothetical Performance Disclosure: Hypothetical performance results have many inherent limitations, some of which are described below. No representation is being made that any account will or is likely to achieve profits or losses similar to those shown; in fact, there are frequently sharp differences between hypothetical performance results and the actual results subsequently achieved by any particular trading program. One of the limitations of hypothetical performance results is that they are generally prepared with the benefit of hindsight. In addition, hypothetical trading does not involve financial risk, and no hypothetical trading record can completely account for the impact of financial risk of actual trading. for example, the ability to withstand losses or to adhere to a particular trading program in spite of trading losses are material points which can also adversely affect actual trading results. There are numerous other factors related to the markets in general or to the implementation of any specific trading program which cannot be fully accounted for in the preparation of hypothetical performance results and all which can adversely affect trading results.

Testimonial Disclosure: Testimonials appearing on this website may not be representative of other clients or customers and is not a guarantee of future performance or success.