
Inflation remains a negative factor

Key Points
- The Producer Price Index and Consumer Price Index provide two different measures of price inflation
- The interplay between the two indexes is meaningful when it reaches an extreme
- The current status of this relationship is at a level that has generally been unfavorable for stocks in the past
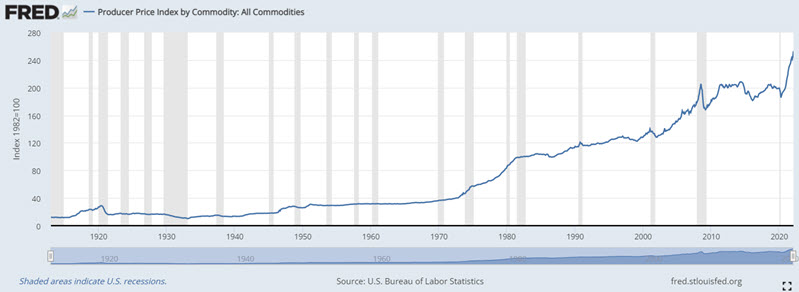
The Producer Price Index
The Producer Price Index program measures the average change over time in the selling prices received by domestic producers for their output. The prices included in the PPI are from the first commercial transaction for many products and some services. The chart below displays the raw monthly index data courtesy of https://fred.stlouisfed.org/.
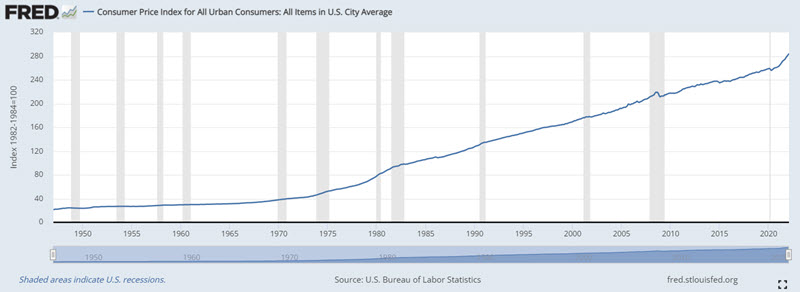
The Consumer Price Index
The Consumer Price Index (CPI) measures the average change over time in the prices paid by urban consumers for a market basket of consumer goods and services.
The chart below displays the raw monthly index data courtesy of https://fred.stlouisfed.org/.
The calculations
More important than the raw level of each index is the rate at which it is rising or falling.
At the end of each month, I compare the latest index reading to the reading 12 months prior and refer to that as the "12-month % rate-of-change." I then compare the two readings, as follows:
- A = 12-month % rate-of-change for the Producer Price Index
- B = 12-month % rate-of-change for the Consumer Price Index
- C = A - B
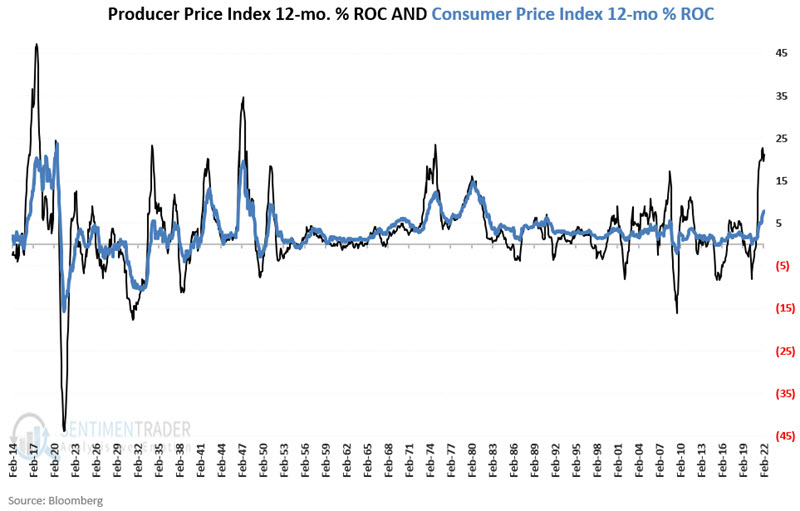
The chart below displays the 12-month rate-of-change for both indexes.
The chart below shows the month-end difference between the two (Variable C), with the +7.00 level also highlighted.
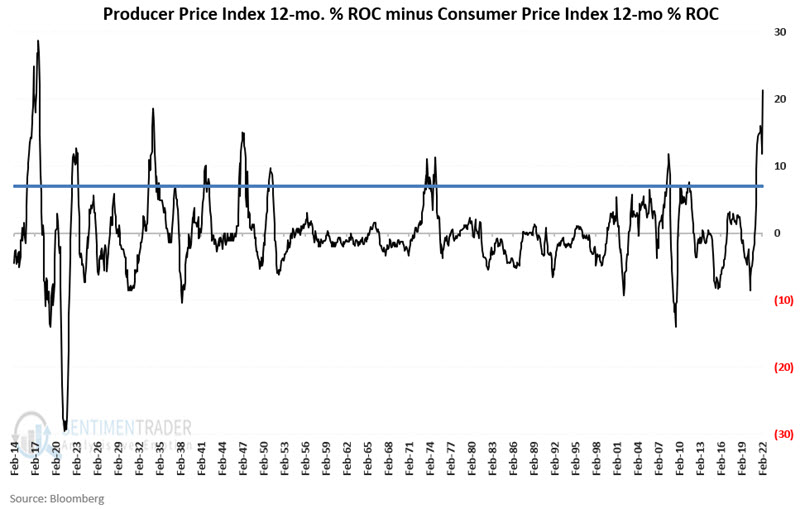
As you can see in the chart above, most of the time, the difference between the two rates of change is less than +7.00. But on those rare occasions when this value exceeds +7.00, it highlights an abnormal state of affairs. As we will see in a moment, this is typically not favorable for stocks.
When the difference matters
The PPI is generally considered a leading gauge for CPI, i.e., as costs increase at the producer level, those costs eventually get passed onto the consumer level. A reading of +7.00 indicates that the 12-month % rate-of-change for the PPI is more than seven percentage points higher than the 12-month % rate-of-change for the CPI.
The chart below displays the cumulative growth of $1 invested in the Dow Jones Industrial Average ONLY when Variable C is less than or equal to +7.00.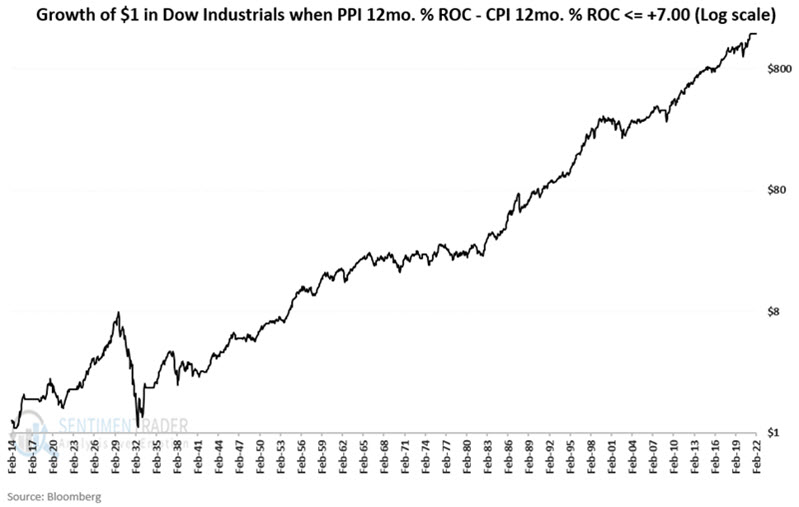
From February 1914 through February 2022, the Dow gained +155,482% when Variable C was less than
The chart below displays the cumulative growth of $1 invested in the Dow Jones Industrial Average ONLY when Variable C is greater than +7.00.
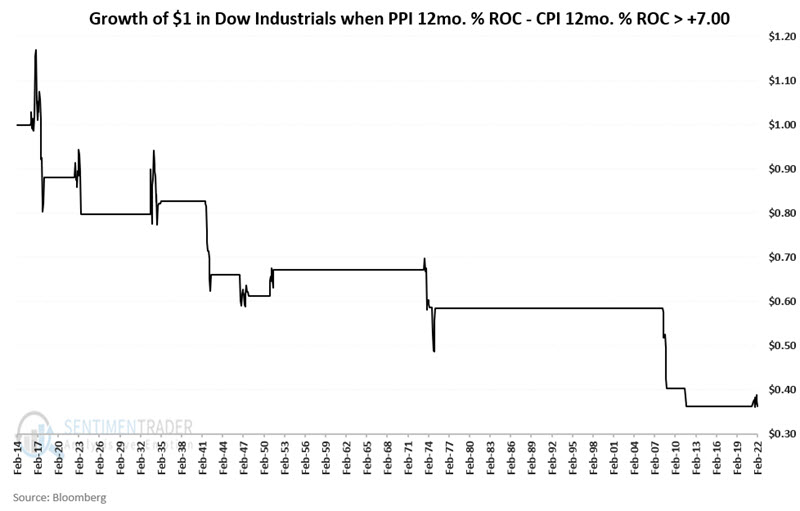
From February 1914 through February 2022, the Dow lost -64% when Variable C was greater than +7.00.
The table below displays the performance of the Dow Jones Industrial Average during those periods when PPI inflation was seven or more points higher than CPI inflation.
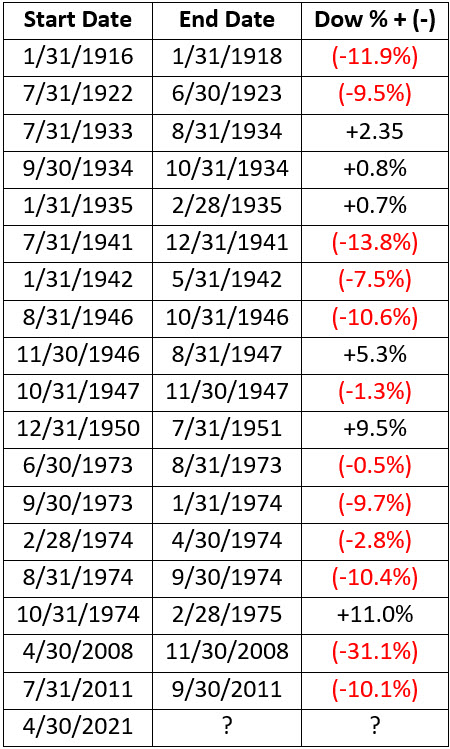
Interestingly, since the "unfavorable" signal on 4/30/2021, the major stock market indexes are essentially unchanged. They continued to rally for the next eight months and have since sold off. Technically, breakeven is better than the average previous "unfavorable" period. However, the reading for Variable C remains above +7.00, so this measure remains unfavorable.
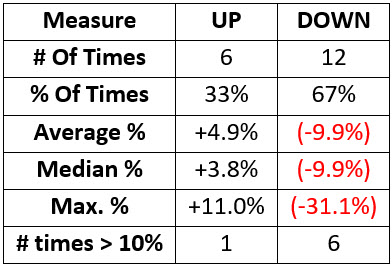
The table below shows a summary of results for the previous periods.
What the research tells us…
Moderate inflation is normal and expected, and the stock market generally performs just fine during those periods. However, when inflation reaches an abnormally high (or low) level, it is a warning sign for stocks in general. And when the Producer Price Index is rising at a rate far more than the Consumer Price Index, it suggests a highly abnormal state of economic affairs, warranting heightened investor caution.