
Inflation fires a warning shot across the bow

Key points:
- The latest 12-month percentage change in the Producer Price Index spiked to +9.8%
- Historically, readings above +9% has tended to be unfavorable for stocks overall
- In this note, we detail the history of Dow Jones Industrial Average performance over the past 110 years when PPI inflation exceeded 9%
The Producer Price Index 12-month change crosses above 9%
The Producer Price Index (PPI) is a measure from the Bureau of Labor Statistics (BLS) that tracks the average change over time in selling prices received by domestic producers for their output. It acts as a key indicator of wholesale inflation.
Note that the PPI data is typically updated mid-month. However, for testing purposes, all analysis below assumes we update only at the end of each month.
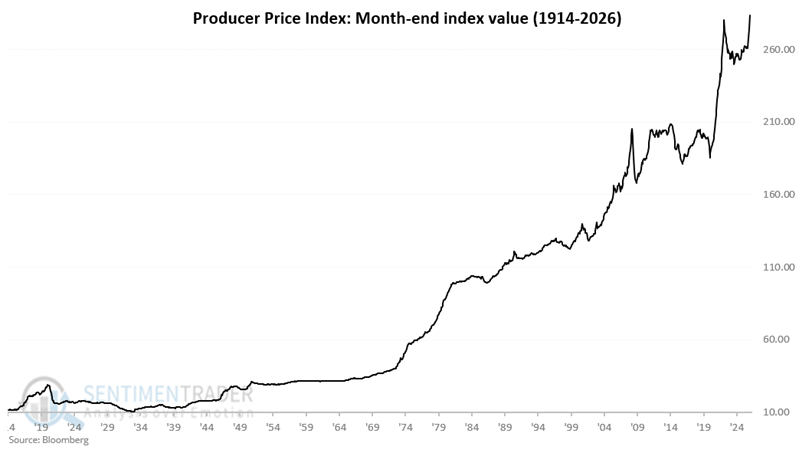
The chart below shows the index's history since 1914. Note that it fluctuates both up and down over time, with an overall long-term bias to the upside.
The real question regarding PPI, however, is not the raw price level but the rate of change. We use the 12-month percentage rate of change as a measure of wholesale inflation. The chart below shows the 12-month % change for PPI since 1914. The horizontal line represents the +9% cutof