
Inflation and Staples versus Discretionary

Key Points
- It is well established that extremes in inflation have a profound impact on how consumers spend their money
- What is less well understood is exactly how the relationship between consumer staples and consumer discretionary are affected by changes in inflation
- In the long run, consumer discretionary has significantly outperformed when inflation is moderate and vice versa
Moderate inflation versus extreme inflation
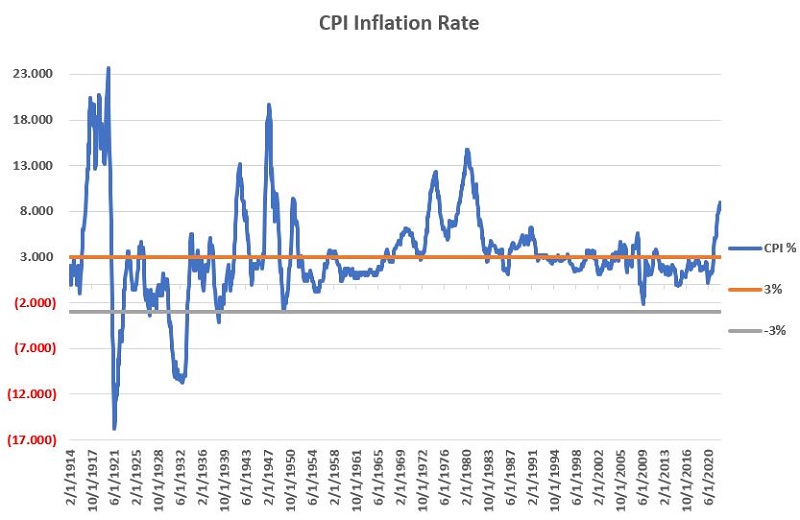
We will measure inflation using the 12-month rate of change in the Consumer Price Index. Regardless of when CPI data is reported, we will only analyze the latest available data at the end of each month.
The chart below displays the 12-month % change for the Consumer Price Index and notes the levels of +3% and -3%.
The rules:
- We will use the month-end reading of the CPI 12-month % change to decide what to hold during the following month
- If inflation is relatively high (greater than or equal to +3%) OR relatively low (less than or equal to -3%, i.e., deflation), we will favor consumer staples
- If inflation is within a range of relatively mild readings (greater than -3% to less than +3%), we will favor consumer discretionary
We will use S&P Industry Group data from Bloomberg dating from January 1st, 1927, through July 13th, 2022
The table below illustrates the strategy rules.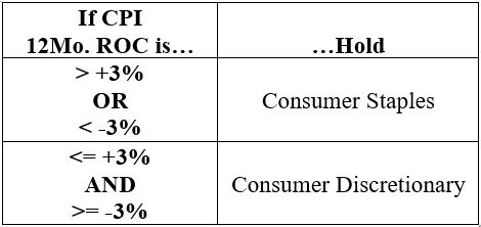
Sector performance during moderate inflation
We define "moderate" inflation as any 12-month CPI % change between +3 and -3%. The 12-month CPI % change has been "moderate" 54.6% of the time. The chart below displays the cumulative % growth of an investment in consumer discretionary (red line) and consumer staples (black line) ONLY during periods of moderate inflation.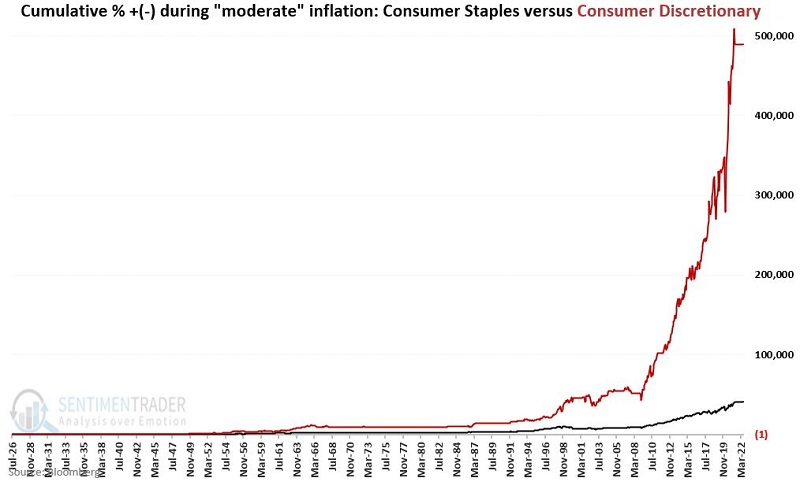
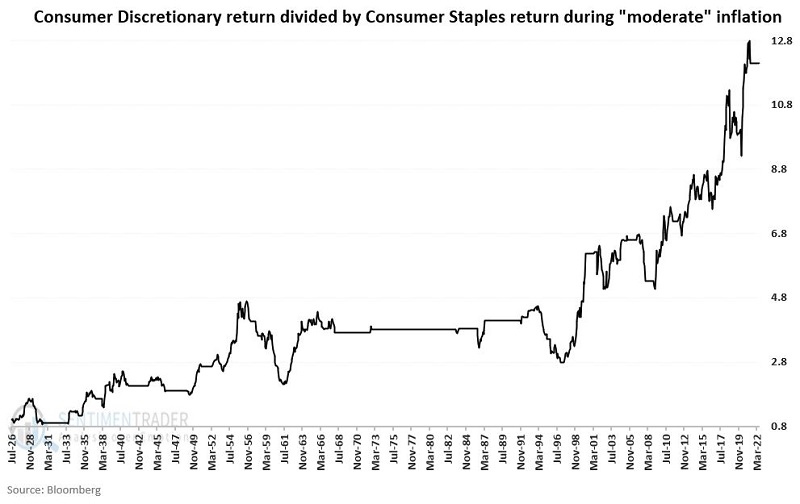
To put results into perspective, the chart below displays:
- Growth in consumer discretionary return during moderate inflation divided by growth in consumer staples
Sector performance during extreme inflation
We define "extreme" inflation as any 12-month CPI % change above +3 or below -3%. The 12-month CPI % change has been "extreme" 45.4% of the time. The chart below displays the cumulative % growth of an investment in consumer discretionary (red line) and consumer staples (black line) ONLY during periods of moderate inflation.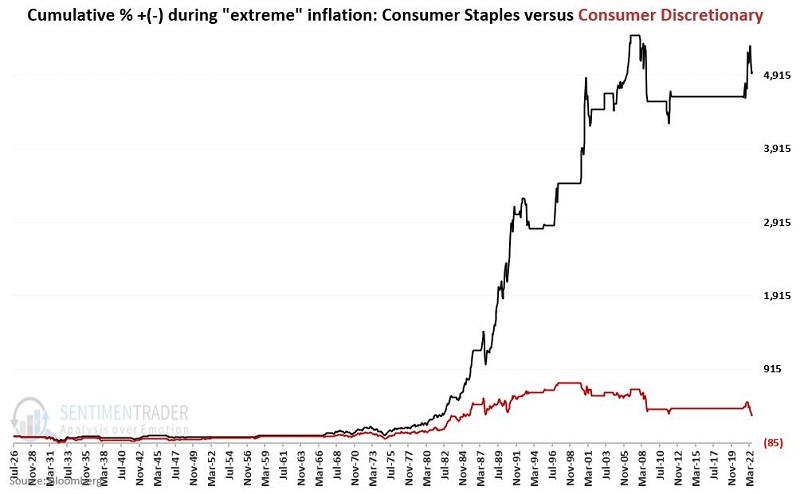
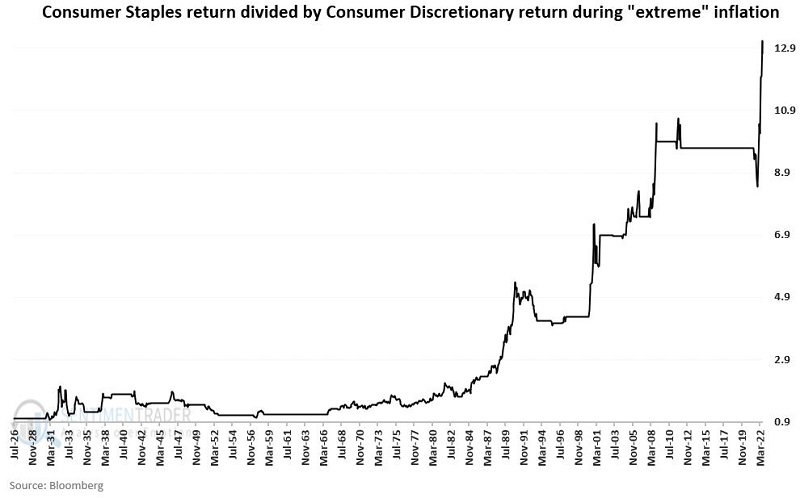
To put results into perspective, the chart below displays:
- Growth in consumer staples return during extreme inflation divided by the growth in consumer staples
Summary of results
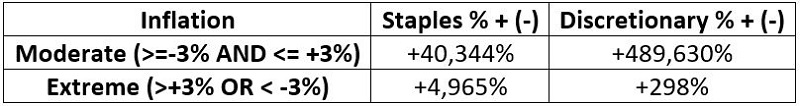
The results of switching
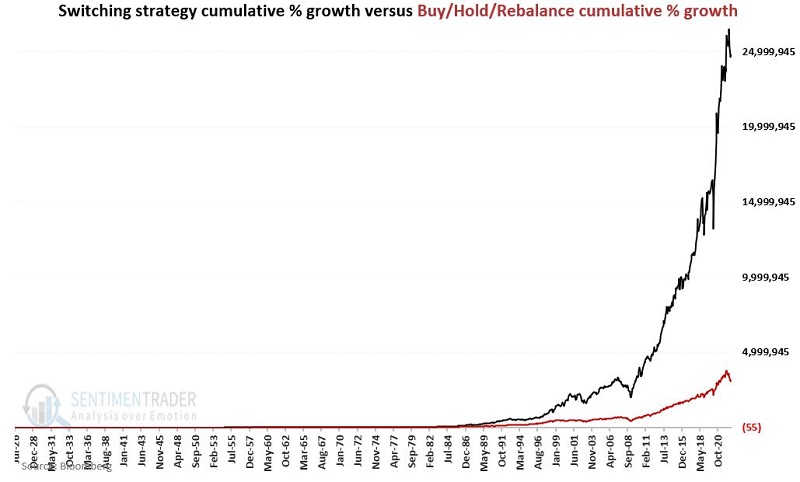
Let's compare a simple switching methodology to a Buy/Hold/Rebalance approach to fully illustrate the effect of switching between staples and discretionary based on inflation.
Switching Rules:
If a month ends with CPI % <= +3% and >=-3% then hold Discretionary
If a month ends with CPI % > +3% or < -3% then hold Staples
Buy/Hold/Rebalance Rules:
- Split 50/50 between Staples and Discretionary
- Rebalance to 50/50 at the end of each calendar year
The chart below displays the comparative cumulative growth for Switching versus Buy/Hold/Rebalance
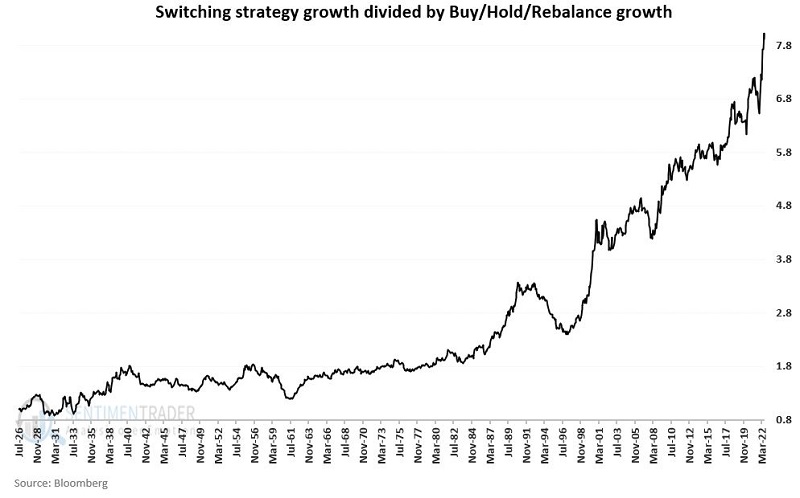
Lastly, the chart below displays the growth of an investment using the Switching method divided by the growth of an investment using the Buy/Hold /Rebalance method.
What the research tells us…
Forming an opinion about where the market may be headed next is far less important than deciding where you will actually commit your capital. While the results detailed above are far from 100% accurate, over the past 90+ years, consumer discretionary stocks have significantly outperformed consumer stapes during periods of "moderate" inflation. Likewise, during periods of "extreme" inflation/deflation, consumer staples have performed much better than consumer discretionary.