Products
SentimenTrader Trading Tools
‍
Backtest Engine
My Trading Toolkit
Correlation Analysis
Seasonality
Market Prediction
Indicators & Data API
‍
Proprietary Indicators & Charts
Market Data API
Strategies & Scanner
‍
50+ Trading Strategies
Smart Stock Scanner
Smart Option Scanner
Research Reports
‍
Research Solutions
Reports Library
Free Resources
Simple Backtest Calculator
Simple Seasonality Calculator
The Kelly Criterion Calculator
Sentiment Geo Map
Public Research Reports
Education
Sentiment Indicators
Technical Indicators
Pricing
Company
About
In the News
Testimonials
Client Success Stories
Contact
Log inLoginSign up
< BACK TO ALL REPORTS

Industry groups are surging, triggering several bullish alerts

Dean Christians
2023-02-03
More than 75% of sub-industry groups closed up more than 20% from a 1-year low. After similar signals, the S&P 500 was higher at some point in the next year in every case since 1938. And a majority of groups are now more than 5% above their 200-day average, suggesting long-term trends are more sustainable.

Key points:

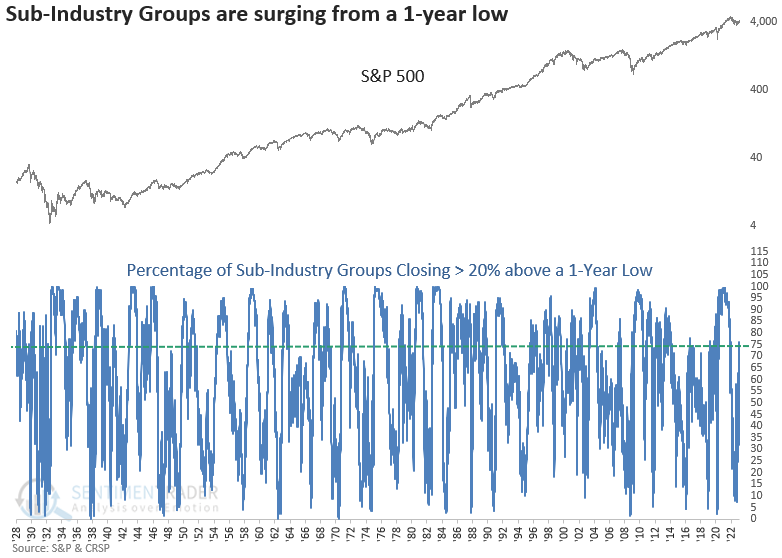
  • More than 75% of sub-industry groups closed > 20% above their 1-year low
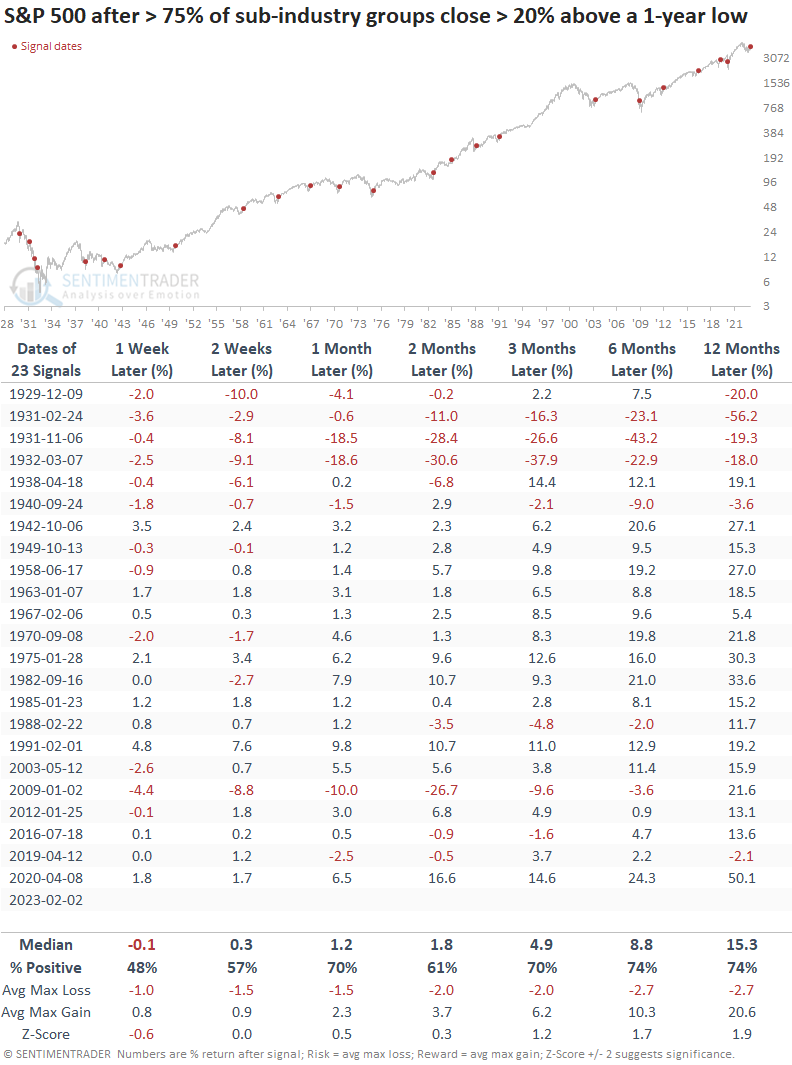
  • When industries surge from a 1-year low, the outlook for stocks is excellent 
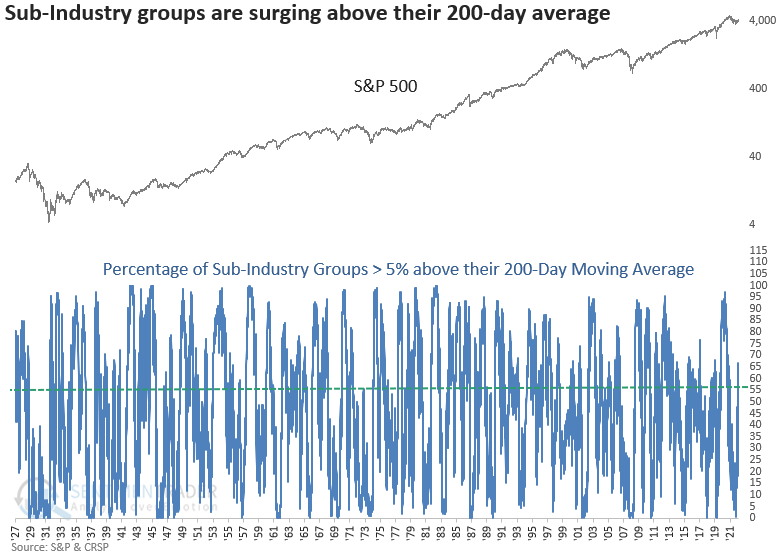
  • More than 56% of sub-industry groups closed > 5% above their 200-day average
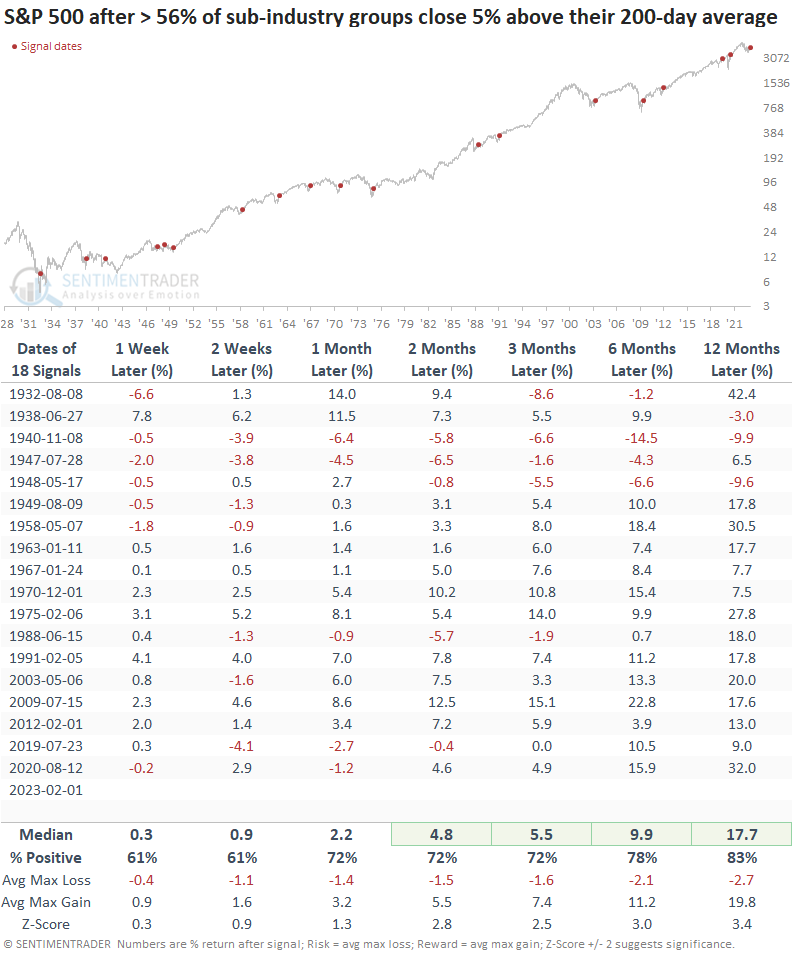
  • After similar thrusts above the 200-day, the S&P 500 showed exceptional upside consistency

Industry price trends continue to shift in favor of the bulls

Regarding the bull-bear debate, I prefer to let the data talk. And, right now, the bulls are winning the argument as just about everything I see is improving. i.e., it's more than just short covering driving the recovery.

One such indicator, the percentage of sub-industry groups closing > 20% above their respective 1-year low, surged above 75%. The recovery occurred after fewer than 10% closed 20% above their annual low. 

An additional improvement in price trends occurred when more than 56% of sub-industry groups closed greater than 5% above their 200-day average. The improvement occurred after fewer than 1% of groups closed more than 5% above the average.

Similar surges from a 1-year low bode well for stocks

When 75% of sub-industry groups close greater than 20% above their respective 1-year low, the S&P 500 was higher at some point in the next year in every case since 1938. The signal experienced several whipsaw alerts during the 1929-32 bear market, which is not surprising given the volatility in that period.  

A higher hurdle rate for the % of groups above the 200-day average

Usually, market analysts utilize the percentage of issues above the 200-day average to gauge long-term participation trends for a basket of securities. While it's an excellent indicator, I also like to look at the percentage of issues trading 5% above the 200-day. When securities surge above a higher hurdle rate, the trend change is more likely to be sustained rather than failing around the average.

Similar surges above the 200-day bode well for stocks

When 56% of sub-industry groups close greater than 5% above their 200-day average, the S&P 500 was higher at some point in the next year in all but one case. Consistency since 1949 is excellent, with no losses in the six or twelve-month windows.

What the research tells us...

Sub-industry groups, which incorporate small, medium, and large capitalization stocks, are improving no matter how one measures price trends. The broad recovery pushed the percentage of sub-industry groups closing > 20% above their respective 1-year low above 75%, a level associated with excellent long-term results for the S&P 500. And a majority of sub-industry groups surged more than 5% above their 200-day average, which suggests stocks are shifting to a potentially more sustainable long-term uptrend. 

PRODUCTS
SentimenTrader
Trading Tools
Indicators & Data API
‍
Strategies & Scanner
‍
Research Reports
FREE
RESOUrCES
Simple Backtest
Calculator
Simple Seasonality
Calculator
The Kelly Criterion
Calculator
Sentiment Geo Map
‍
Public Research Reports
‍
Education
Sentiment Indicators
‍
Technical Indicators
‍
Pricing
Bundle pricing
‍
FAQ
‍
Announcements
‍
COMPANY
‍
About
‍
In the News
‍
Testimonials
‍
Client Success Stories
CONTACT
‍
General Inquiries
‍
Media Inquiries
‍
Financial Professionals Inquiries
‍
© 2026 Sundial Capital Research Inc. All rights reserved.
Setsail Marketing
TermsPrivacyAffiliate Program
Risk Disclosure: The information and tools provided are for research and analytical purposes only and are not intended as investment advice. Market analysis involves uncertainty, and outcomes may differ from expectations. Users should conduct their own due diligence and consider their individual circumstances before making any financial decisions. Past performance is not necessarily indicative of future results.

Hypothetical Performance Disclosure: Hypothetical performance results have many inherent limitations, some of which are described below. No representation is being made that any account will or is likely to achieve profits or losses similar to those shown; in fact, there are frequently sharp differences between hypothetical performance results and the actual results subsequently achieved by any particular trading program. One of the limitations of hypothetical performance results is that they are generally prepared with the benefit of hindsight. In addition, hypothetical trading does not involve financial risk, and no hypothetical trading record can completely account for the impact of financial risk of actual trading. for example, the ability to withstand losses or to adhere to a particular trading program in spite of trading losses are material points which can also adversely affect actual trading results. There are numerous other factors related to the markets in general or to the implementation of any specific trading program which cannot be fully accounted for in the preparation of hypothetical performance results and all which can adversely affect trading results.

Testimonial Disclosure: Testimonials appearing on this website may not be representative of other clients or customers and is not a guarantee of future performance or success.