Products
SentimenTrader Trading Tools
‍
Backtest Engine
My Trading Toolkit
Correlation Analysis
Seasonality
Market Prediction
Indicators & Data API
‍
Proprietary Indicators & Charts
Market Data API
Strategies & Scanner
‍
50+ Trading Strategies
Smart Stock Scanner
Smart Option Scanner
Research Reports
‍
Research Solutions
Reports Library
Free Resources
Simple Backtest Calculator
Simple Seasonality Calculator
The Kelly Criterion Calculator
Sentiment Geo Map
Public Research Reports
Education
Sentiment Indicators
Technical Indicators
Pricing
Company
About
In the News
Testimonials
Client Success Stories
Contact
Log inLoginSign up
< BACK TO ALL REPORTS

Industry and hedging action lend favorable weight to the bullish case

Jay Kaeppel
2025-06-02
The recent spike and reversal in the number of bearish industries, and the action of stock index futures hedgers relative to speculators, have added weight to the bullish side of the weight of the evidence ledger. Details herein.

Key points

  • Favorable indicator signals should be thought of as "weight of the evidence" and not as automatic "buy signals"
  • Still, when a variety of typically reliable indicators generate favorable signals within a short time, it often signifies a buying opportunity for stocks
  • Our Industry % Indexes in Bear Market and Major Index Combo hedging indicators recently flashed favorable signals

A favorable confirmation from Industry Indexes

Our Industry % Indexes in Bear Market indicator shows the percentage of 23 industries that are trading more than 20% below their 52-week highs. Typically, a rise above 10% indicates a buyable pullback in an ongoing bull market or the onset of an actual bear market. When this indicator rises above 10%, one can only speculate which of these two possibilities will ultimately play out. So, one approach is to wait for this value to drop back below 10% to suggest that the worst may be over. In reality (and as we will see in the chart below), this index can flit above and below 10% several times before ultimately heading lower.

The chart below highlights all dates when the indicator value crossed below 10%. 

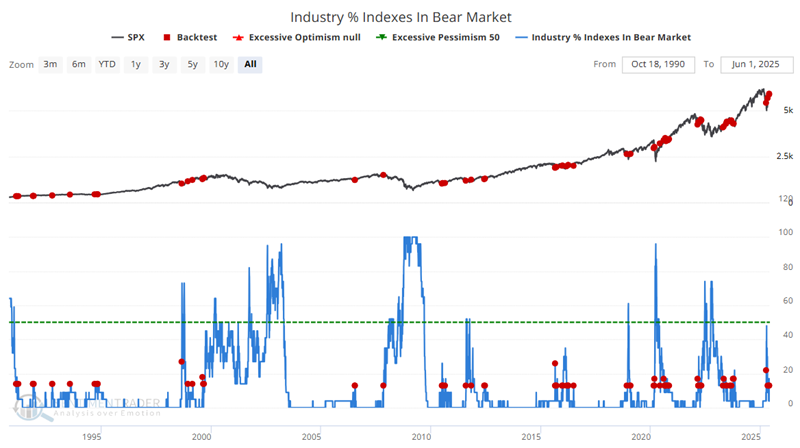
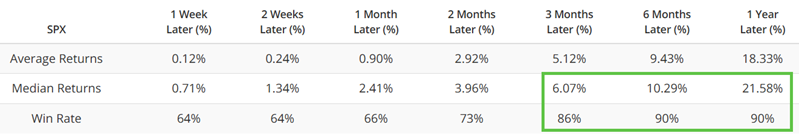
The most recent signals occurred on 2025-04-24, 2025-05-12, 2025-05-27, and 2025-05-29. The table below summarizes S&P 500 performance following the signals highlighted above.

There is no way to know if this index will again jump back above 10% in the near term. Nevertheless, the implication of recent signals is favorable for stocks over the next three to twelve months.

A favorable confirmation from our Major Index Combo

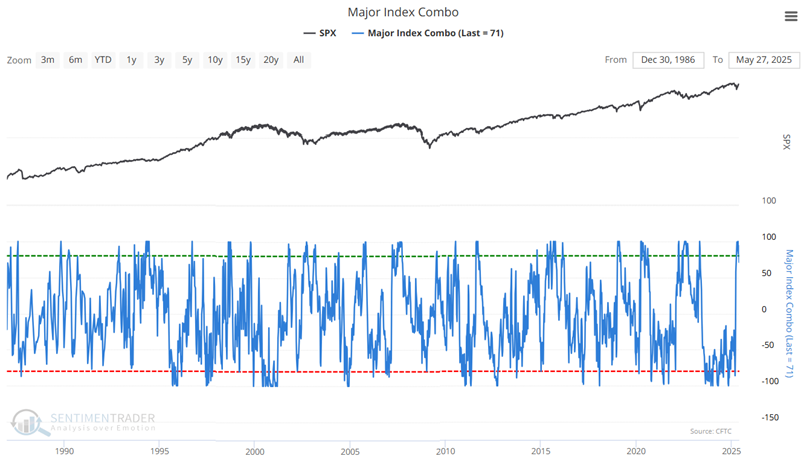
Our Major Index Combo indicator is based on weekly data and reflects hedgers' and small speculators' positions in the S&P 500, Nasdaq 100, and DJIA futures. It combines the full contract and e-mini, adjusting for contract size, and calculates the dollar value. The chart is a one-year stochastic of hedger positions minus speculator positions, so if it reads 100, then hedgers are the most exposed to stocks in at least a year, and speculators are the least exposed.

This is computed as a non-contrary indicator, so it can be a good sign for stocks when the Combo is exceptionally high (an indicator reading above 80). Conversely, readings below 20 are usually a negative sign for stocks.

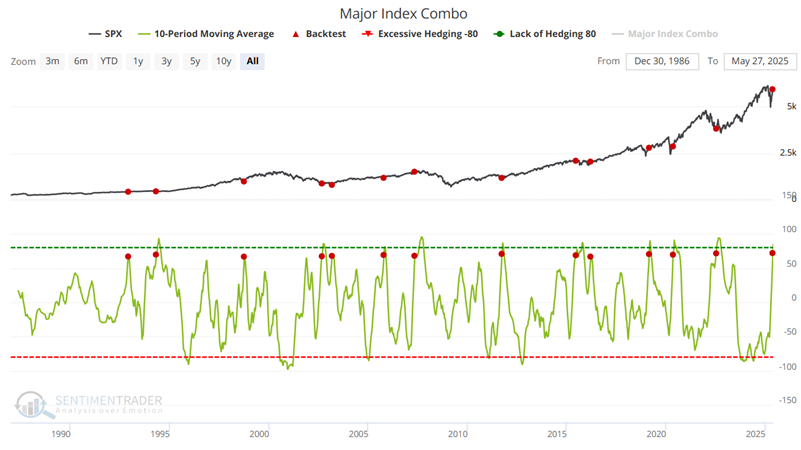
The chart below highlights all dates when the 10-week average for the Major Index Combo crossed above 66. The most recent signal occurred on 2025-05-20.

The table below summarizes S&P 500 performance following the signals highlighted above.

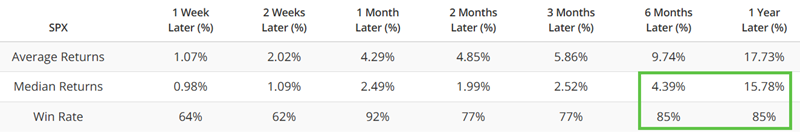
The table below displays S&P 500 performance signal-by-signal.

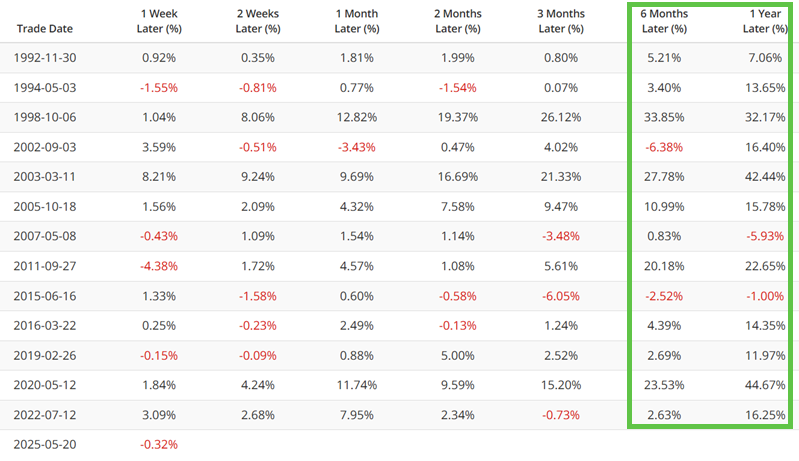
The recent spike in this indicator is a favorable factor for stocks in the year ahead.

What the research tells us…

Each indicator signal highlighted above has a solid long-term track record on a standalone basis. Combined, they offer a powerful argument that the outlook is favorable for stocks. That said, it is always important to remember that no favorable indicator - or combination of indicators -guarantees higher stock prices. Nevertheless, from a "weight of the evidence" perspective, the information above suggests giving the bullish case the benefit of the doubt unless and until price action provides us with a reason not to.

PRODUCTS
SentimenTrader
Trading Tools
Indicators & Data API
‍
Strategies & Scanner
‍
Research Reports
FREE
RESOUrCES
Simple Backtest
Calculator
Simple Seasonality
Calculator
The Kelly Criterion
Calculator
Sentiment Geo Map
‍
Public Research Reports
‍
Education
Sentiment Indicators
‍
Technical Indicators
‍
Pricing
Bundle pricing
‍
FAQ
‍
Announcements
‍
COMPANY
‍
About
‍
In the News
‍
Testimonials
‍
Client Success Stories
CONTACT
‍
General Inquiries
‍
Media Inquiries
‍
Financial Professionals Inquiries
‍
© 2026 Sundial Capital Research Inc. All rights reserved.
Setsail Marketing
TermsPrivacyAffiliate Program
Risk Disclosure: The information and tools provided are for research and analytical purposes only and are not intended as investment advice. Market analysis involves uncertainty, and outcomes may differ from expectations. Users should conduct their own due diligence and consider their individual circumstances before making any financial decisions. Past performance is not necessarily indicative of future results.

Hypothetical Performance Disclosure: Hypothetical performance results have many inherent limitations, some of which are described below. No representation is being made that any account will or is likely to achieve profits or losses similar to those shown; in fact, there are frequently sharp differences between hypothetical performance results and the actual results subsequently achieved by any particular trading program. One of the limitations of hypothetical performance results is that they are generally prepared with the benefit of hindsight. In addition, hypothetical trading does not involve financial risk, and no hypothetical trading record can completely account for the impact of financial risk of actual trading. for example, the ability to withstand losses or to adhere to a particular trading program in spite of trading losses are material points which can also adversely affect actual trading results. There are numerous other factors related to the markets in general or to the implementation of any specific trading program which cannot be fully accounted for in the preparation of hypothetical performance results and all which can adversely affect trading results.

Testimonial Disclosure: Testimonials appearing on this website may not be representative of other clients or customers and is not a guarantee of future performance or success.