
Industry action suggests a market at the crossroads

Key points
- Our Industry % Indexes in Bear Market indicator is starting to flash signs of an oversold condition
- It is important to remember that "oversold" and "buy" are not synonymous
- Recent action is not necessarily a "call to action" but rather a "call to be prepared to take action"
Understanding Industry % Indexes in Bear Market
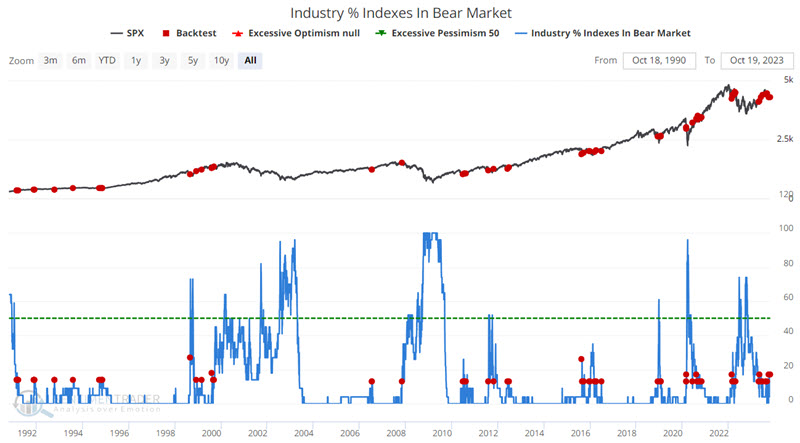
Our Industry % Indexes in Bear Market indicator shows the percentage of 23 industries that are trading more than 20% below their 52-week highs. Bull markets tend to be accompanied by low readings and vice versa. Higher readings can be potentially very bad as this action highlights a breakdown in market breadth as industry groups suffer significant declines.
The reality, however, is this. Occasionally, a rise in this indicator from a low level will signal the onset of a new primary bear market - one that sees the major indexes decline -20% or more, typically over one to three years. However, historically, more often than not, a rise from a low level has accompanied a normal pullback in an ongoing bear market - and ultimately has signaled a buying opportunity. The problem is that there is no way to know which scenario will transpire in advance.
Hence, the latest action for this indicator should be viewed not as a "buy" signal but as a "be prepared to buy (but also prepare to play defense if the major indexes break down further)" signal. In other words, it signals a market at a crossroads.
Industry % Indexes in Bear Market indicator is oversold
The chart below highlights all dates when the Industry % Indexes in Bear Market indicator crossed above 10%, and the table summarizes subsequent S&P 500 performance.
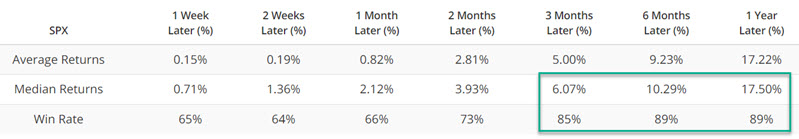
The cautionary part of this tale can be seen in 2007 and early 2022. Significant market declines followed these periods in the ensuing twelve months. Likewise, signals in early 2020 before the COVID plunge ultimately proved quite profitable but involved riding that plunge all the way down. Outside of these periods, 95% of all other signals were followed by double-digit gains for the S&P 500 twelve months later, with a median gain of 21.3%.
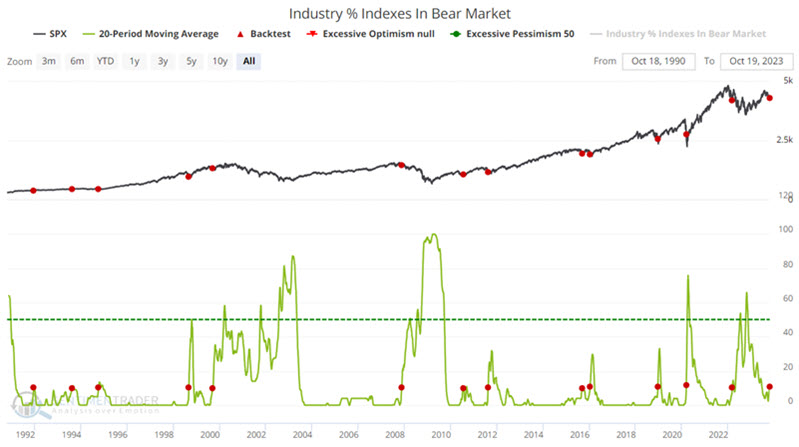
Let's filter out some of the duplicate signals in the test above. The chart below highlights those dates when the 20-day moving average for the Industry % Indexes in Bear Market indicator crossed above 10% for the first time in three months.
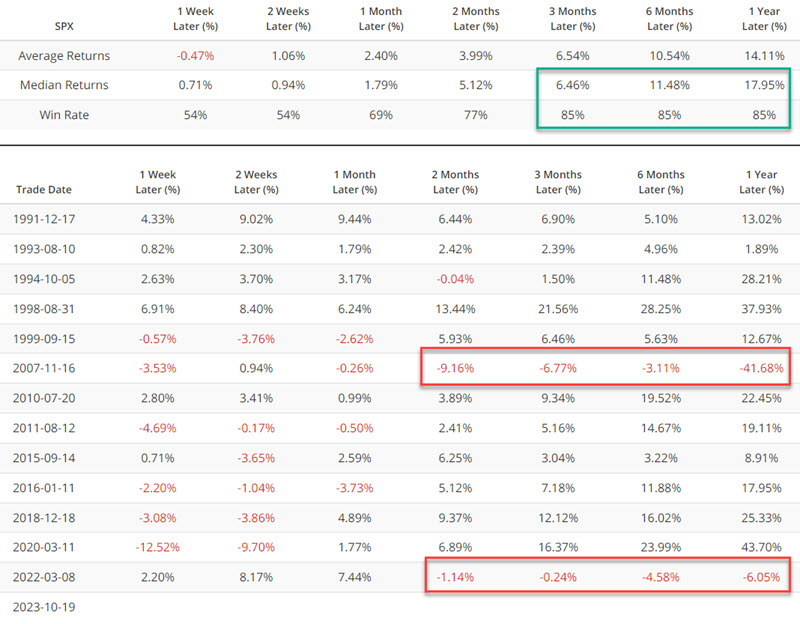
The results above again highlight the potential usefulness - and potential pitfalls - associated with using this indicator as a standalone signal generator (which we do not suggest). The periods highlighted in the red boxes remind us that buying into a decline always risks playing with fire. The 2007 signal was brutally wrong, and the March 2022 signal would have resulted in riding the market significantly lower before the market bottomed.
Conversely, the Win Rates and Median Returns for three-to-twelve-month periods remind us that pullbacks in an ongoing bull market can be highly beneficial to alerting investors with cash to invest. These numbers also remind us of the importance of giving the bullish case the benefit of the doubt.
What the research tells us…
What do the results tell us for sure? Only that the market is presently in a period of significant internal market weakness. Bearish investors will view this as a signal to lighten up on stocks or avoid the market altogether. Bullish investors will argue that we are amid a buying opportunity. Who is right? Only time will tell who is right - or wrong.
We can surmise that where the market goes from here will offer a vital clue.