
Industry action flashes a favorable sign

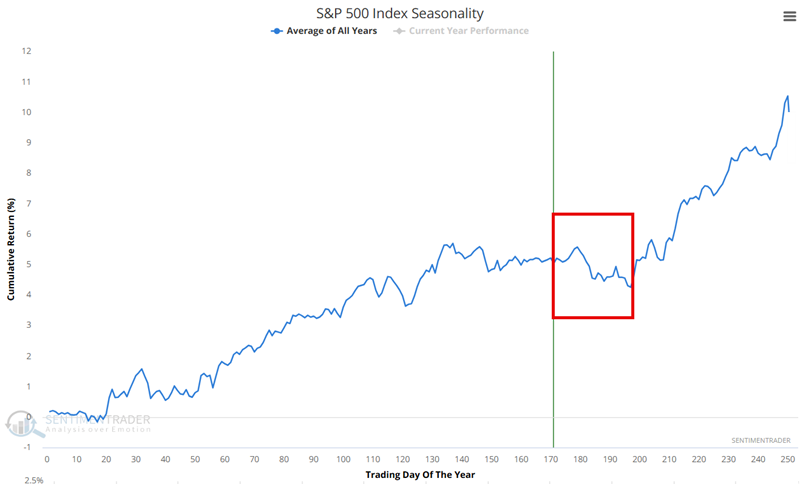
The stock market remains in an often treacherous seasonal period. So the potential for a pullback between now and mid-to-late October remains a concern.
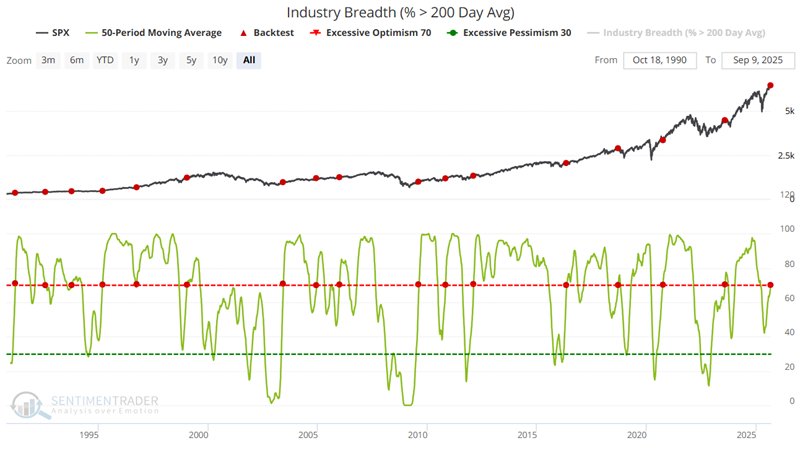
That said, signs pointing to a favorable outlook for the year ahead continue to emerge. The Industry Breadth (% > 200 Day Avg) indicator shows the percentage of 23 industries trading above their 200 Day moving averages.
The chart below highlights all dates when the indicator's 50-day moving average crossed above 70%. The most recent signal occurred on September 5th.
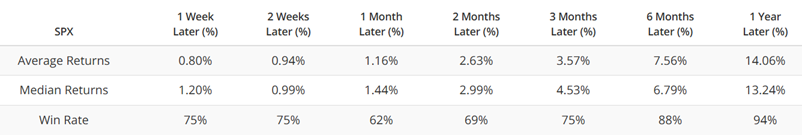
The tables below summarize S&P 500 performance following previous signals.
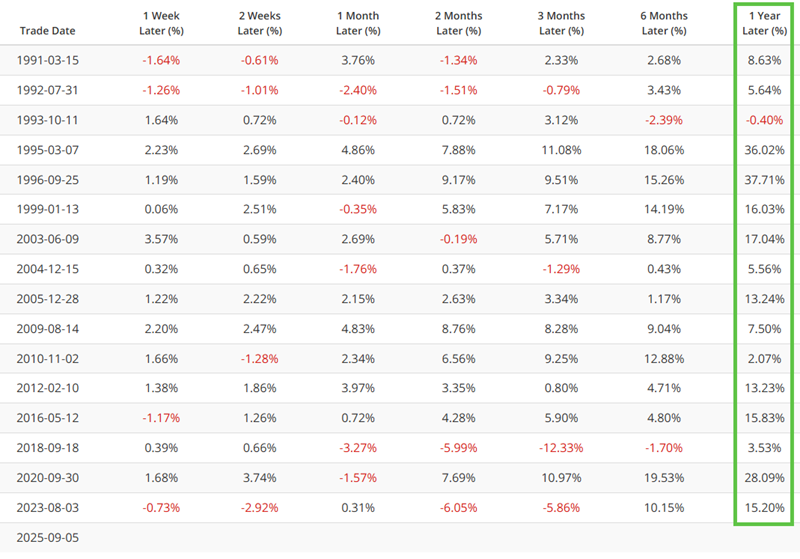
Does the recent signal guarantee higher stock prices twelve months from now? Not at all. But it does lend weight to the favorable side of the weight of the evidence ledger.