Products
SentimenTrader Trading Tools
‍
Backtest Engine
My Trading Toolkit
Correlation Analysis
Seasonality
Market Prediction
Indicators & Data API
‍
Proprietary Indicators & Charts
Market Data API
Strategies & Scanner
‍
50+ Trading Strategies
Smart Stock Scanner
Smart Option Scanner
Research Reports
‍
Research Solutions
Reports Library
Free Resources
Simple Backtest Calculator
Simple Seasonality Calculator
The Kelly Criterion Calculator
Sentiment Geo Map
Public Research Reports
Education
Sentiment Indicators
Technical Indicators
Pricing
Company
About
In the News
Testimonials
Client Success Stories
Contact
Log inLoginSign up
< BACK TO ALL REPORTS

Industrial sector cracks in the foundation

by Sentimentrader
2026-04-23
This Sentimentrader report highlights growing foundational cracks in the S&P 500 industrial sector (XLI), flagging extreme single-day fund outflows, 49-week high insider selling, and looming seasonal headwinds. Historical data shows these signals point to elevated short-term downside risk and poor risk-reward for new long positions.

Keywords:

  • XLI fund flows an impressive single-day outflow;
  • Insiders are selling;
  • Seasonality suggests a bumpy road ahead;

Industrial is testing the patience of the bulls

While the index remains in a structural uptrend, the internal metrics is beginning to weaken. The headline price action-holding above key moving averages at 171.04-hides a growing list of tactical red flags that suggest the sector is priced for a perfection that the current macro backdrop may not deliver.

A massive liquidity exit

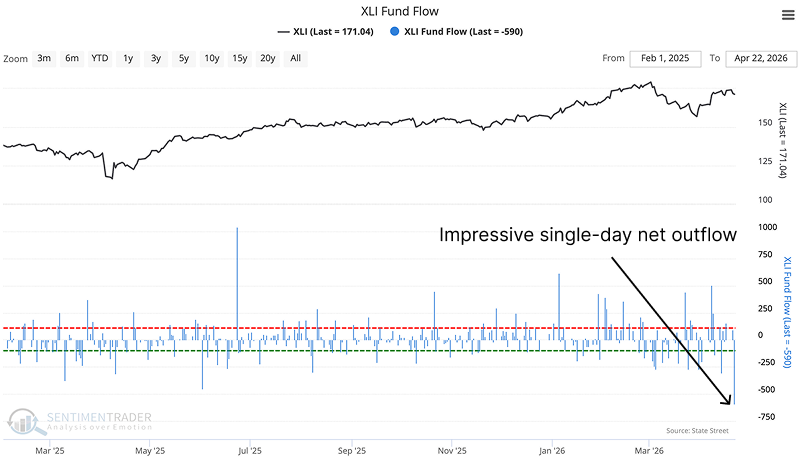
The most immediate concern is the sudden vacuum in capital. Yesterday, the XLI saw a net outflow of roughly $590 million, a single-day redemption that ranks among the largest in recent history.
Industrial sector cracks in the foundation

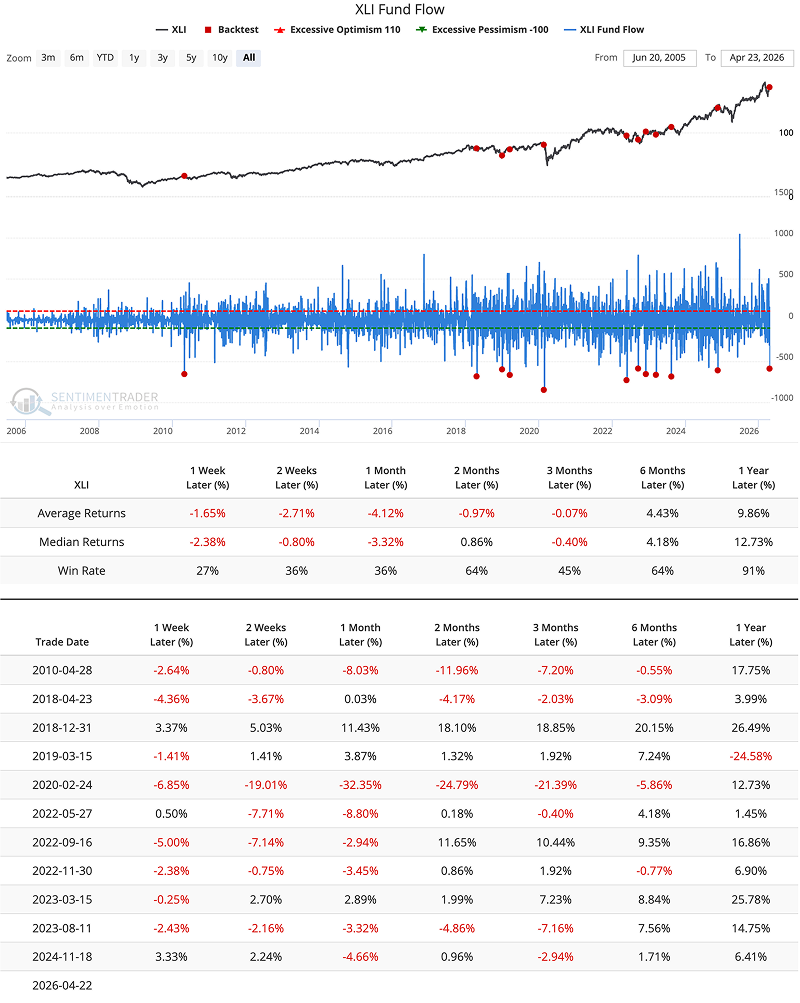
To put that in perspective, there have been only ten instances of larger single-day outflows in the past two decades.

Historically, when fund flows hit this level of exhaustion, the short-term forward returns are underwhelming. Following similar signals, the index was lower one week later 73% of the time, with average losses of nearly 1.7%. One month out, the weakness typically persists, with the index remaining lower 64% of the time.
Industrial sector cracks in the foundation

Insiders are hitting the exits

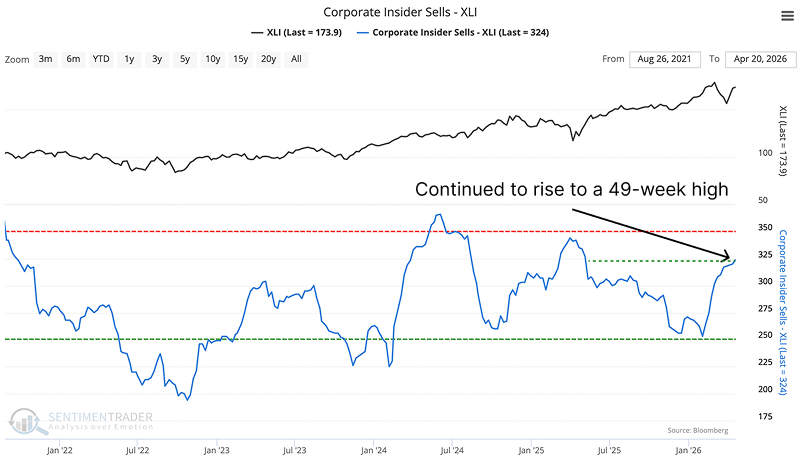
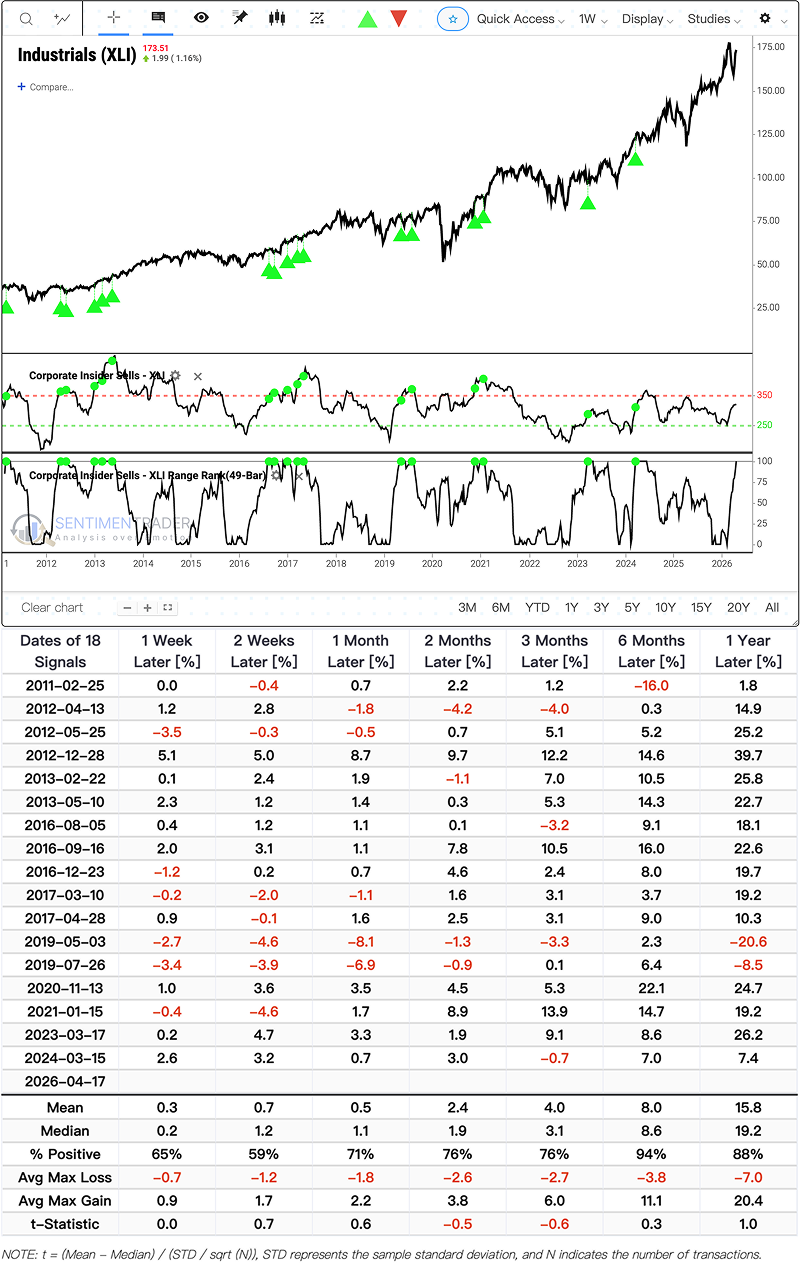
Corporate insiders are not waiting around to see if the uptrend holds. Insider selling in the industrial sector has climbed to a 49-week high, a level often associated with local price peaks.
Industrial sector cracks in the foundation

While insider selling can be noisy, the persistent nature of this move-accelerating even as the index hit new highs earlier this month-suggests that those with the best view of the order books are finding current valuations a convenient place to trim exposure.Click here to see the backtest details.
Industrial sector cracks in the foundation

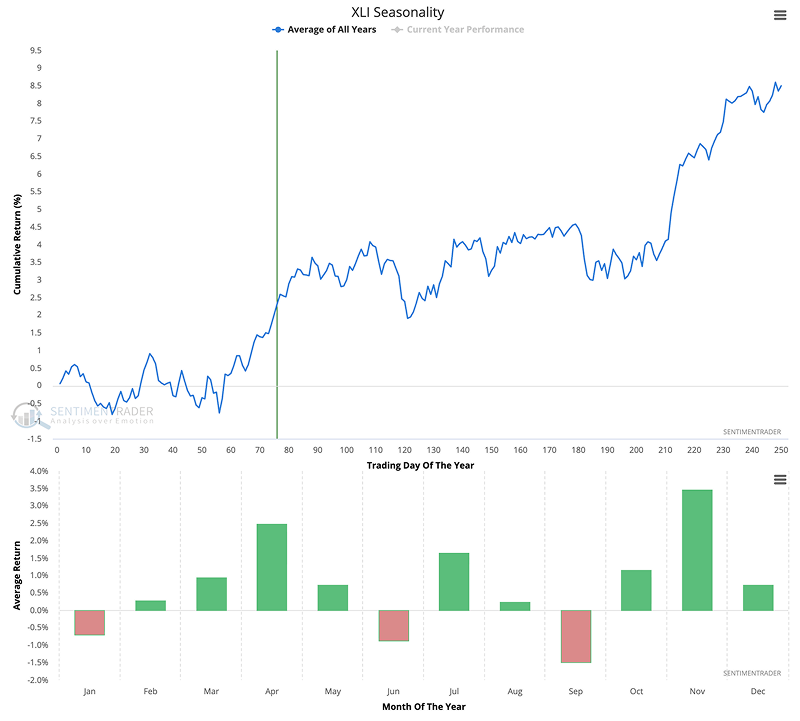
The seasonality headwind

The calendar is also losing its shine. We are entering a historically "bumpy" window for industrials.
Industrial sector cracks in the foundation

Cumulative return data shows that the strength typically seen in March and April tends to fade as we approach May and June. April has historically been the second strongest month of the year for the sector, averaging a 2.5% gain, but June is frequently a period of weakness, averaging a loss of nearly 1%.

What the research tells us ...

Input price indexes are also rising for the second consecutive month, fueled by supply chain disruptions from the ongoing Middle East conflict. These rising costs, combined with a decline in March industrial production, suggest that the "growth" narrative is increasingly driven by price hikes rather than volume.

The technical and flow data argue for a period of consolidation. When we look at previous clusters of insider selling at 49-week highs alongside extreme fund outflows, the risk-reward for new long positions is objectively poor.

The data favors a tactical pullback toward the 168-170 range, provided the 50-day moving average holds as a pivot. If manufacturing PMI data scheduled for early May fails to confirm the expansion, the "base rate" of historical failures suggests that the current seasonal bumpiness could turn into a deeper correction.

PRODUCTS
SentimenTrader
Trading Tools
Indicators & Data API
‍
Strategies & Scanner
‍
Research Reports
FREE
RESOUrCES
Simple Backtest
Calculator
Simple Seasonality
Calculator
The Kelly Criterion
Calculator
Sentiment Geo Map
‍
Public Research Reports
‍
Education
Sentiment Indicators
‍
Technical Indicators
‍
Pricing
Bundle pricing
‍
FAQ
‍
Announcements
‍
COMPANY
‍
About
‍
In the News
‍
Testimonials
‍
Client Success Stories
CONTACT
‍
General Inquiries
‍
Media Inquiries
‍
Financial Professionals Inquiries
‍
© 2026 Sundial Capital Research Inc. All rights reserved.
Setsail Marketing
TermsPrivacyAffiliate Program
Risk Disclosure: The information and tools provided are for research and analytical purposes only and are not intended as investment advice. Market analysis involves uncertainty, and outcomes may differ from expectations. Users should conduct their own due diligence and consider their individual circumstances before making any financial decisions. Past performance is not necessarily indicative of future results.

Hypothetical Performance Disclosure: Hypothetical performance results have many inherent limitations, some of which are described below. No representation is being made that any account will or is likely to achieve profits or losses similar to those shown; in fact, there are frequently sharp differences between hypothetical performance results and the actual results subsequently achieved by any particular trading program. One of the limitations of hypothetical performance results is that they are generally prepared with the benefit of hindsight. In addition, hypothetical trading does not involve financial risk, and no hypothetical trading record can completely account for the impact of financial risk of actual trading. for example, the ability to withstand losses or to adhere to a particular trading program in spite of trading losses are material points which can also adversely affect actual trading results. There are numerous other factors related to the markets in general or to the implementation of any specific trading program which cannot be fully accounted for in the preparation of hypothetical performance results and all which can adversely affect trading results.

Testimonial Disclosure: Testimonials appearing on this website may not be representative of other clients or customers and is not a guarantee of future performance or success.