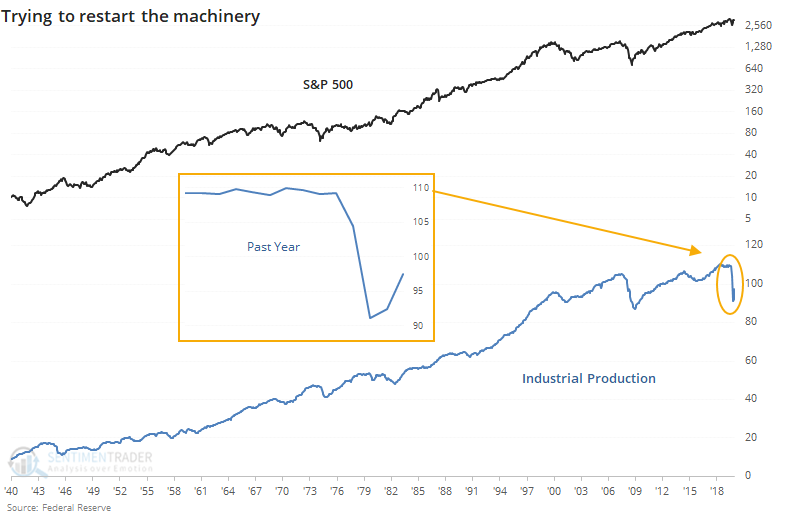
Industrial production gears up

According to the Federal Reserve, the U.S.'s industrial machinery is trying to restart.
As noted by the Wall Street Journal:
"U.S. manufacturing increased in June for the second straight month, a sign of economic recovery in the weeks before the recent surge in coronavirus cases. Industrial production—a measure of output at factories, mines and utilities—rose a seasonally adjusted 5.4% in June from May, the Federal Reserve said Wednesday. That was a bigger increase than the 4% rise anticipated by economists surveyed by The Wall Street Journal."
While the industries captured by this data account for a smaller part of the economy than in decades past, it's a seemingly encouraging sign. We can see how this indicator has coincided with the general trend of stocks over the past 80 years.
Even though economic data tend to trail gyrations in stocks, by the time Industrial Production rebounded at least 5% from a multi-year low, it was still a good sign for stocks going forward.
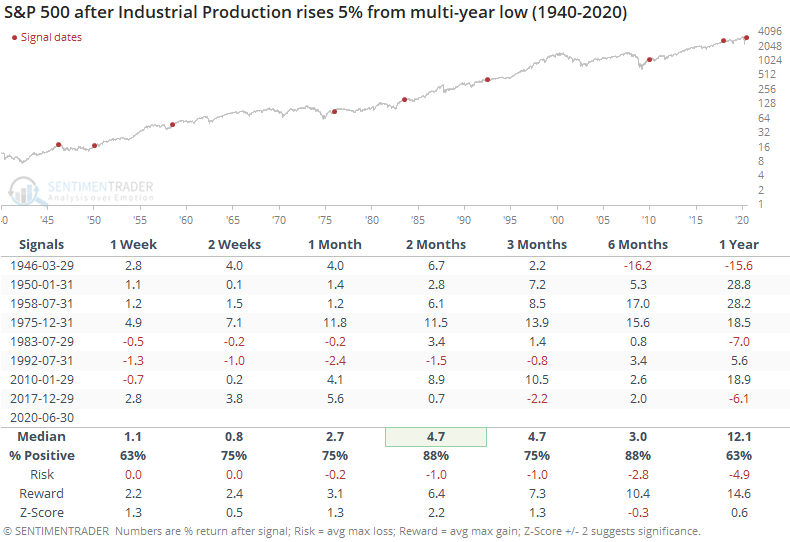
Since 1980, three of the four signals preceded losses in the S&P at some point over the next 1-3 months, so it wasn't an immediate and sustained buy signal. Two of them also showed losses over the next year. Overall, the sweet spot for gains with the lowest risk relative to reward was over the next 2-6 months.
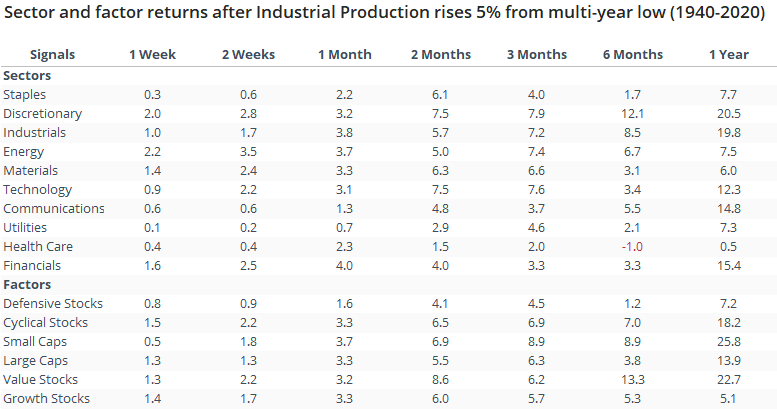
Among sectors, industrial stocks were not the most impressive performers. All sectors and factors showed positive median returns going forward, with discretionary stocks seeing the largest absolute gains, energy stocks the largest gains relative to the random, and financial stocks the most consistent gains.