Products
SentimenTrader Trading Tools
‍
Backtest Engine
My Trading Toolkit
Correlation Analysis
Seasonality
Market Prediction
Indicators & Data API
‍
Proprietary Indicators & Charts
Market Data API
Strategies & Scanner
‍
50+ Trading Strategies
Smart Stock Scanner
Smart Option Scanner
Research Reports
‍
Research Solutions
Reports Library
Free Resources
Simple Backtest Calculator
Simple Seasonality Calculator
The Kelly Criterion Calculator
Sentiment Geo Map
Public Research Reports
Education
Sentiment Indicators
Technical Indicators
Pricing
Company
About
In the News
Testimonials
Client Success Stories
Contact
Log inLoginSign up
< BACK TO ALL REPORTS

Industrial is hot; precious is not

Jason Goepfert
2020-12-11
Over the past month, traders have favored industrial metals like copper over precious metals like gold, with fund flows showing a stark difference.

Traders in ETFs are often considered to be hot money, chasing trends and getting out at the first sign of trouble. In precious metals, that seems to be the case, and they pulled out in a big way over the past month. 

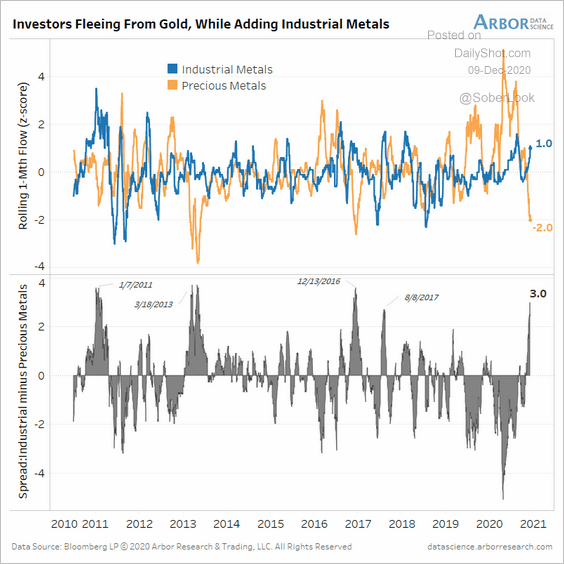
The folks at Arbor Research noted that the z-score on precious metal fund flows hit -2. The z-score measures the current flow relative to the average and standard deviation of previous flows. The more negative the number, the more significant it might be.

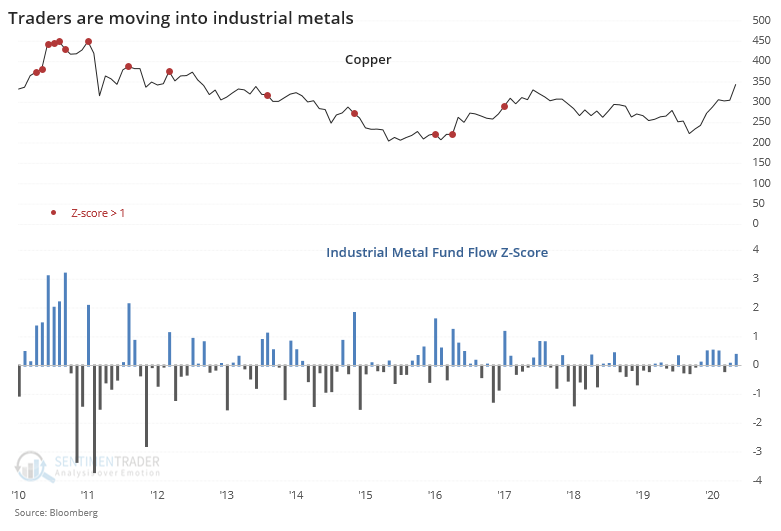
At the same time, they've moved into funds that focus on industrial metals, like copper. It's not all that extreme given some wild gyrations in 2010 and 2011, but it's still positive.

industrial metal etf flow

That means the difference in z-scores between precious metals and industrial metals has dropped to a significantly low level, well below -2. When that's happened before, the ratio of gold to copper tended to rise in the months ahead.


What else is happening

These are topics we explored in our most recent research. For immediate access with no obligation, sign up for a 30-day free trial now.

  • A more in-depth look at fund flows in gold funds
  • Traders have been fleeing GLD in particular
  • Small speculators in gold futures haven't quite given up the ghost
  • Seasonal influences over the next month in gold are impressive

Stat Box

According to Blomberg data, there have been 69 trading days this year that saw at least one IPO priced in the U.S. and that reported net income over the past year. Out of those 69 days, 8 of them saw more IPOs that managed positive net income over the past 12 months while 57 days saw more IPOs that lost money than made money. 

Sentiment from other perspectives

We don't necessarily agree with everything posted here - some of our work might directly contradict it - but it's often worth knowing what others are watching.

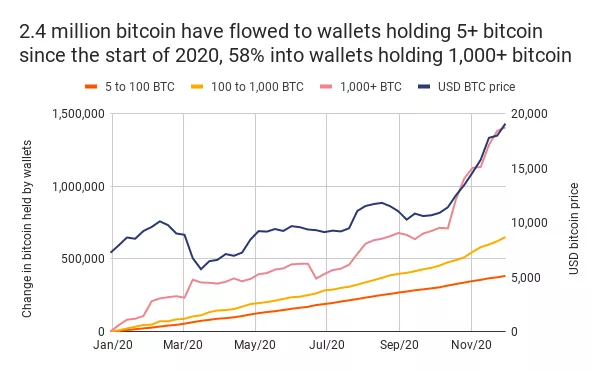
1. Bitcoin bulls insist that the latest leg of the rally has been driven by sophisticated institutional investors, and not mom-and-pop retail noobs. They seem to be right...but that that doesn't necessarily mean that large investors can do no wrong. [Chainanalysis]

bitcoin holder size

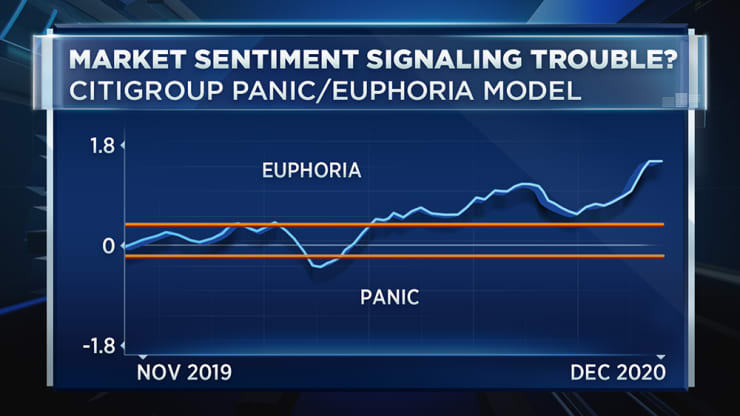
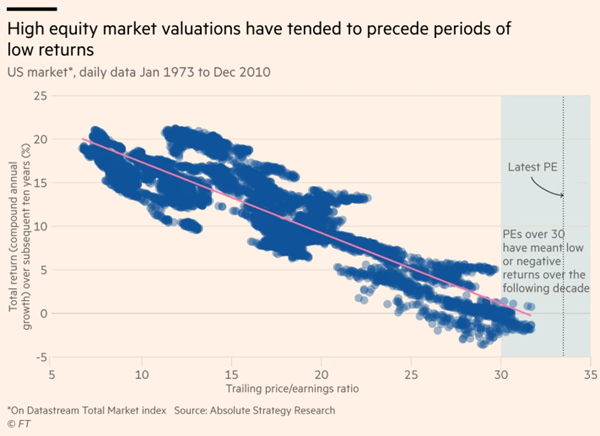
2. Part of the popularity of alternatives is due to seeming excesses in valuations of stocks. When investors have paid up for future earnings potential, their returns have been terrible, a concern given where we are now. [Financial Times]

stock market valuation

3. Those valuations have been achieved because investors are "off the charts bullish." [CNBC]

citi panic euphoria

PRODUCTS
SentimenTrader
Trading Tools
Indicators & Data API
‍
Strategies & Scanner
‍
Research Reports
FREE
RESOUrCES
Simple Backtest
Calculator
Simple Seasonality
Calculator
The Kelly Criterion
Calculator
Sentiment Geo Map
‍
Public Research Reports
‍
Education
Sentiment Indicators
‍
Technical Indicators
‍
Pricing
Bundle pricing
‍
FAQ
‍
Announcements
‍
COMPANY
‍
About
‍
In the News
‍
Testimonials
‍
Client Success Stories
CONTACT
‍
General Inquiries
‍
Media Inquiries
‍
Financial Professionals Inquiries
‍
© 2026 Sundial Capital Research Inc. All rights reserved.
Setsail Marketing
TermsPrivacyAffiliate Program
Risk Disclosure: The information and tools provided are for research and analytical purposes only and are not intended as investment advice. Market analysis involves uncertainty, and outcomes may differ from expectations. Users should conduct their own due diligence and consider their individual circumstances before making any financial decisions. Past performance is not necessarily indicative of future results.

Hypothetical Performance Disclosure: Hypothetical performance results have many inherent limitations, some of which are described below. No representation is being made that any account will or is likely to achieve profits or losses similar to those shown; in fact, there are frequently sharp differences between hypothetical performance results and the actual results subsequently achieved by any particular trading program. One of the limitations of hypothetical performance results is that they are generally prepared with the benefit of hindsight. In addition, hypothetical trading does not involve financial risk, and no hypothetical trading record can completely account for the impact of financial risk of actual trading. for example, the ability to withstand losses or to adhere to a particular trading program in spite of trading losses are material points which can also adversely affect actual trading results. There are numerous other factors related to the markets in general or to the implementation of any specific trading program which cannot be fully accounted for in the preparation of hypothetical performance results and all which can adversely affect trading results.

Testimonial Disclosure: Testimonials appearing on this website may not be representative of other clients or customers and is not a guarantee of future performance or success.