
Indicator Signals You Were Probably Not Aware Of

Key points:
- Our experience is that no single indicator should be trusted to be forever 100% correct (even if it has been in the past). Therefore, we prefer a weight-of-evidence approach to analyzing markets
- Four different indicators that many investors rarely follow, or maybe are not even aware of, recently flashed favorable signals
- In this note, we highlight the relationship between volatile and less volatile stocks, consumer confidence, option open interest, and buying climaxes among S&P 500 stocks
S&P High Beta / S&P High Quality Relative Ratio Rank showing "risk on" behavior
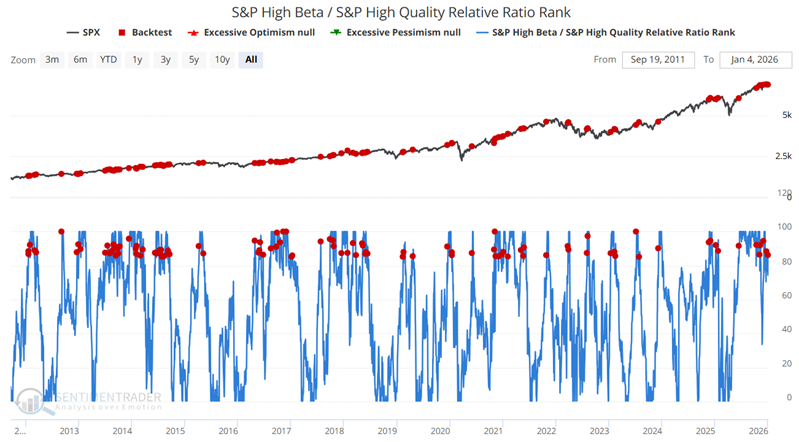
The first indicator to highlight is our S&P High Beta / S&P High Quality Relative Ratio Rank indicator. This indicator examines the relationship between high-beta (i.e., more volatile) and high-quality (i.e., less volatile) stocks. The chart illustrates the ratio's position relative to its range over the past four months. When the relative ratio is high, investors are showing risk-on behavior. When the ratio drops to a low level, they are exhibiting risk-off behavior.
In theory, the stock market should perform better when investors are in "risk on" mode, as aggressive buying stands to propel stock prices higher. The chart below highlights all dates when the indicator crossed above 85, including all overlapping signals. The most recent signal occurred on January 2nd. This is an example of a "continuation" signal.
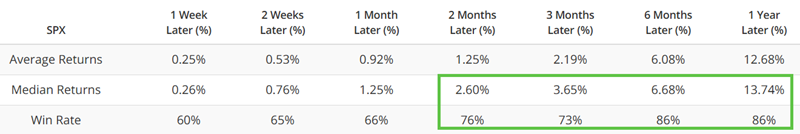
The table below summarizes the subsequent performance of the S&P 500. The key thing to note is the decent returns and win rates for periods of two months and beyond, especially for six and twelve months.
As a reminder, this indicator (as well as the ones that follow) is not intended to be used as a standalone trading model, only as weight-of-the-evidence.
University of Michigan Consumer Confidence shows deep pessimism
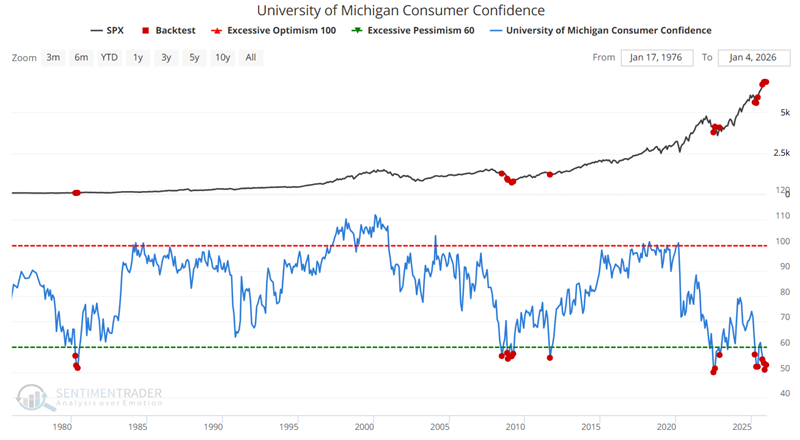
The University of Michigan Consumer Sentiment Index is a consumer confidence index published monthly by the University of Michigan. The index is normalized to have a value of 100 in December 1964.
The Index focuses on three broad areas:
- How consumers view prospects for their own financial situation
- How they view prospects for the general economy over the near term
- Their view of prospects for the economy over the long term
At the extremes, the survey is a decent contrary indicator. This indicator has spent most of the last year in deeply pessimistic territory. However, recent actions have been anomalous from historical results. Previously, this indicator tended to reach low readings when the stock market was in a state of decline, and pessimistic sentiment has often pointed towards bottoms in the stock market. However, the most recent cluster of pessimistic readings from the index has been accompanied by successively higher highs in stocks.
How will things play out this time? Is it different this time? No one can predict. But until proven otherwise, bearish sentiment is bearish sentiment, and we should respect the tendency of the stock market to rally following pessimistic Consumer Confidence readings.
The chart below highlights all months when the U of M Consumer Confidence Index read 58 or lower.
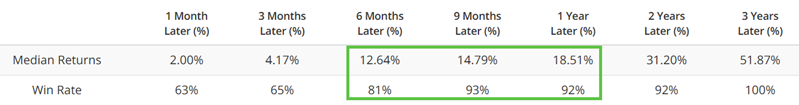
The table below summarizes the subsequent performance of the S&P 500.
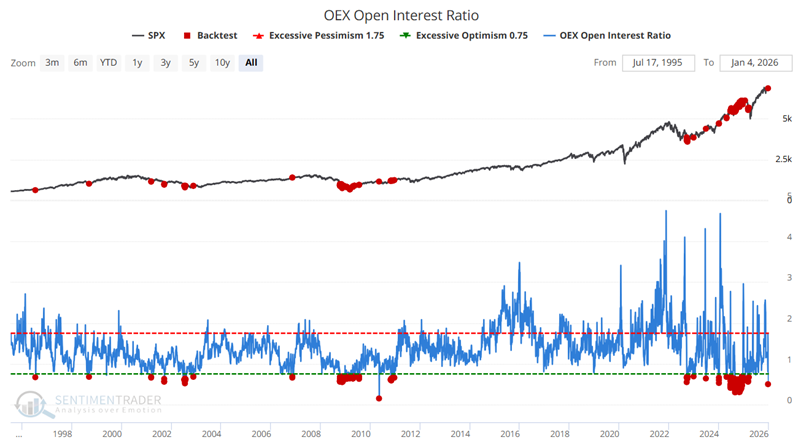
 OEX Open Interest Ratio falls to an extreme
OEX is shorthand for the S&P 100, an index made up of the 100 largest companies in the S&P 500. Open interest is defined as the total number of outstanding option contracts. Open interest is increased by opening transactions and decreased by closing transactions. Someone buying a call to open (a bullish position) would increase open interest by one, and someone selling a call to open (a bearish position) would also increase open interest by one.
The chart below highlights all dates when the OEX Open Interest Ratio indicator was below 0.70. Note that these signals often happen in clusters. The most recent signal occurred on December 31st, 2025.
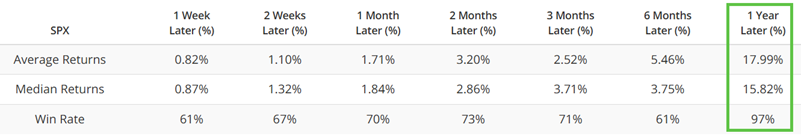
The table below summarizes the subsequent performance of the S&P 500. Note that results through six months are positive, but relatively pedestrian. Still, while we would not use this as a standalone trading system, the twelve-month win rate of 97% and median return of 15.82% suggest that longer-term investors continue to give the bullish case the benefit of the doubt.
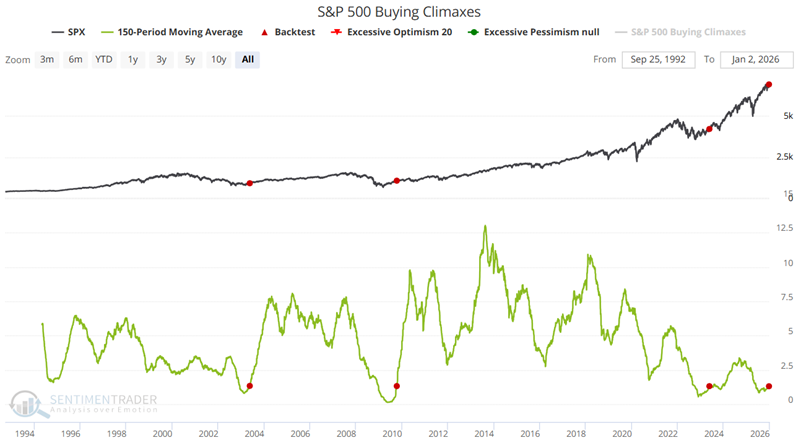
 A longer-term look at S&P 500 Buying Climaxes offers a surprising take
In its purest form, our S&P 500 Buying Climaxes indicator is designed to identify potential topping action in the stock market and to warn of potential impending underperformance.
This raw daily indicator measures the number of stocks in the S&P 500 that reached a 52-week high during the week, then closed below the prior week's close. It suggests a climax in buying interest among investors, which is a sign of exhaustion. When the number of buying climaxes reaches an extreme, it indicates a significant amount of buying exhaustion in the market, likely leading to poor returns in the medium term.
However, as with many indicators, stretching performance over a period of time can lead to useful signals of a different variety. The test we will perform now looks for the 150-day moving average of S&P 500 Buying Climaxes to cross above 1.30 for the first time in twelve months. This type of action is very rare. The most recent signal occurred on December 29th, 2025.
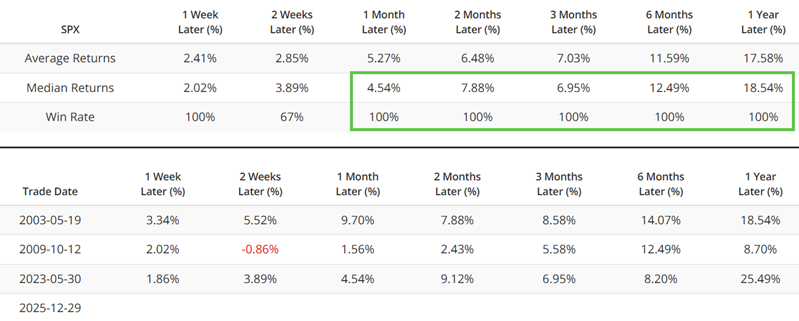
The table below summarizes the subsequent performance of the S&P 500. Note that the sample size is minuscule, so it is risky to draw conclusions from this data. Still, under the category of "weight of the evidence," the results following the previous few signals are compelling.
What the research tells us…
It is helpful to remember that there is a difference between an "indicator" and a "trading system." A trading system is typically designed to generate specific entry and exit signals in a given market. An indicator merely offers occasional weight of the evidence to one side of the ledger. It is also helpful to remember that not every action for a given indicator "means something," and that not every "signal" from a given indicator should be viewed as an automatic "buy" or "sell" signal. Even an indicator signal that has a "100% Win Rate" in the past over a given timeframe is never guaranteed to be correct the next time it flashes (sorry, I don't make the rules). Every one of the recent indicator signals detailed above a) lends weight to the favorable side of the weight of the evidence ledger, but b) does not by itself constitute an outright "buy" signal for stocks.
The key point is that two market action indicators (High Beta versus Low Beta stocks, and S&P 500 Buying Climaxes) and two sentiment indicators (Consumer Confidence and S&P 100 Open Interest)are all flashing signals in the same direction within the same time frame. Does this guarantee a continued bull market for stocks? Not necessarily. Does this suggest that investors continue to give the bullish case the benefit of the doubt? We report, you decide.