
Indicator signals for longer-term investors

Key points:
- To the surprise of few, the stock market has been struggling during the month of September
- Could things get worse? Absolutely. However, looking ahead, a variety of indicators are flashing favorable signals for stocks over the next six to twelve months
- Below we highlight several recent signals that suggest that - while anything can happen along the way - long-term investors might do well to ignore the noise and continue to focus on the major trend
High Beta versus High Quality crosses a key level
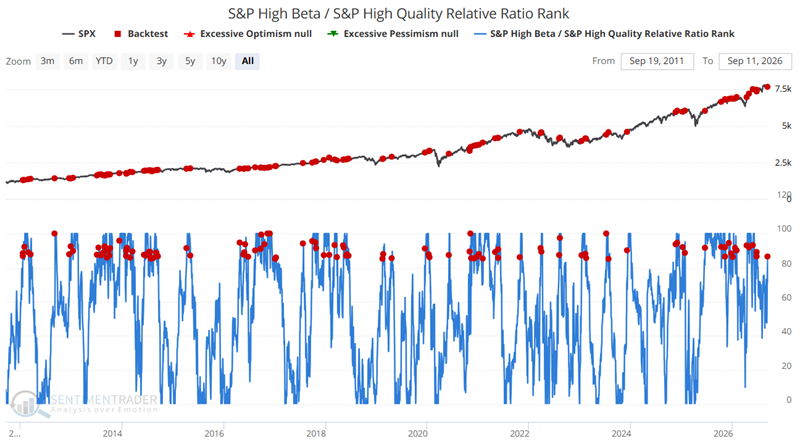
The S&P High Beta / S&P High Quality Relative Ratio Rank indicator shows where the ratio is relative to its range over the past four months. When the relative ratio is high, investors are showing risk-on behavior. When the ratio drops to a low level, they are exhibiting risk-off behavior.
The chart below highlights all dates when the indicator crossed above 85. The most recent signal occurred on September 8th.