
Indicator shows Fear is back

Key points:
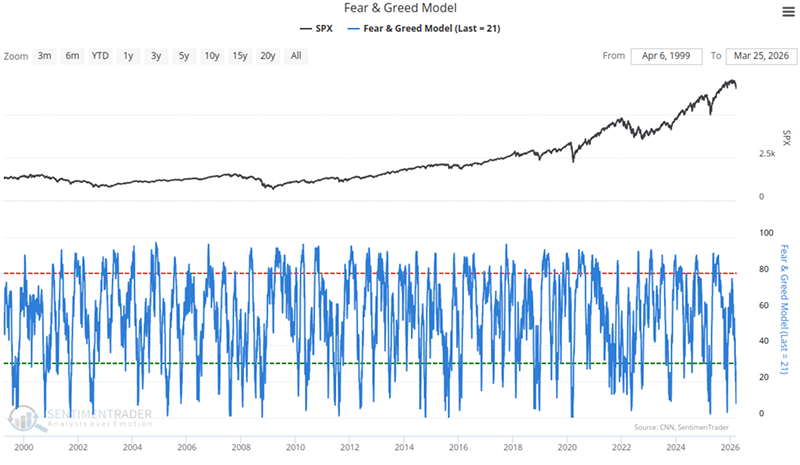
- The Fear & Greed Model, a sentiment indicator, declined to one of the lowest levels in history
- After similar signals, the S&P 500 struggled over the subsequent two months
- A more favorable setup occurs after the model cycles from less than 10% to greater than 66%
Sentiment indicators work best when they reverse from an extreme
Sentiment measures are increasingly revealing a growing sense of pessimism in an environment that already exhibits a lack of confidence in the stock market's prospects.
Recently, one of those indicators, the Fear & Greed Model, dropped below 10% for only the 31st time since 1998, suggesting a heightened level of fear among investors.
Similar sentiment extremes suggest the S&P 500 could struggle
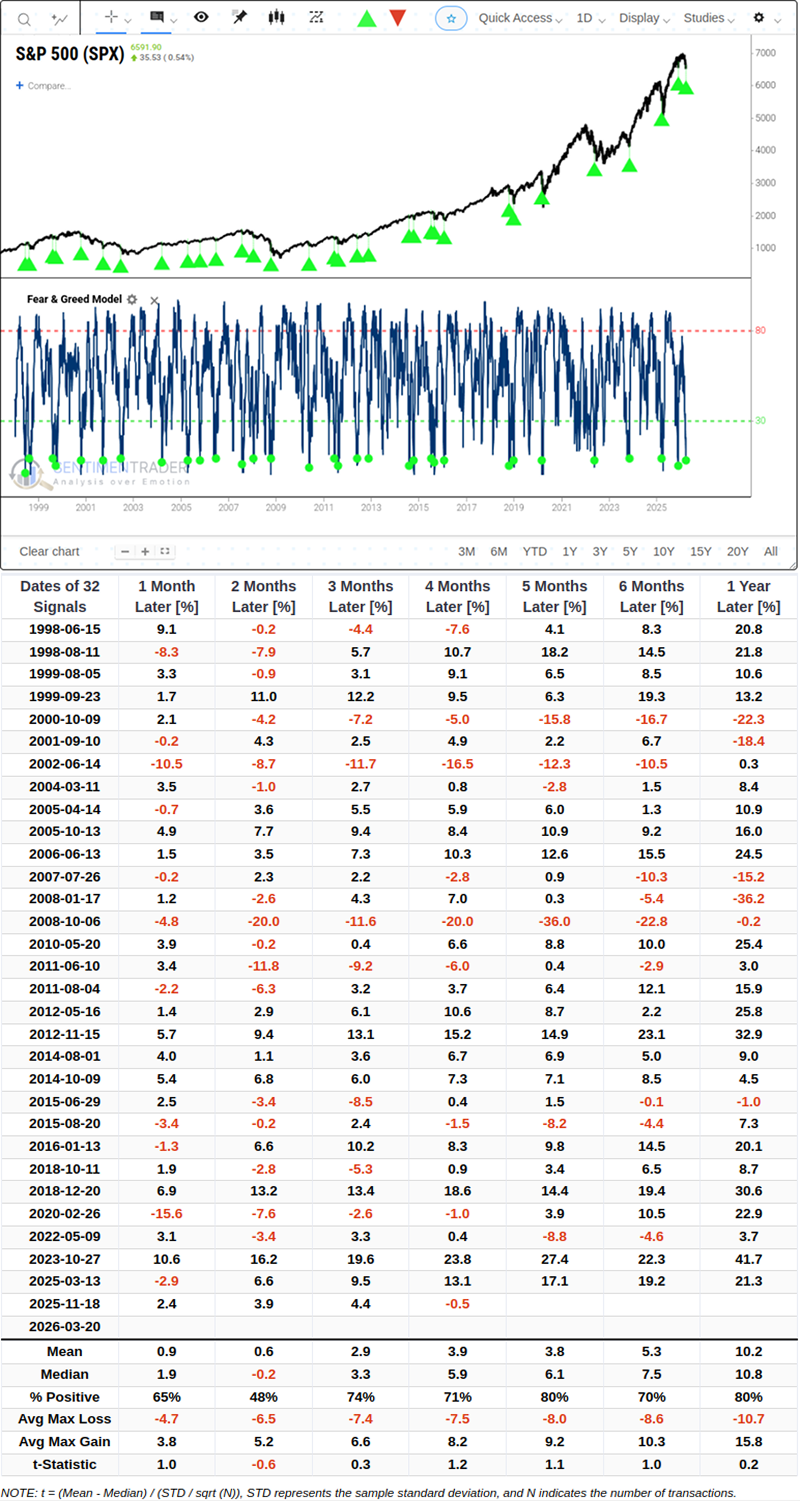
Whenever the Fear & Greed Model dips below 10%, the S&P 500 encounters difficulties in the following two months.
Two months out, the S&P 500 was higher just 48% of the time, carrying a negative median return.Related Backtest Click Here.
The S&P 500 triggered this recent signal while simultaneously trading below its 200-day moving average. Filtering the history for this dual condition narrows the sample to 24 instances.
Two months after these specific signals, the median return jumps to 3.5%. Extend the timeline to four months, and the index was higher 83% of the time, averaging a gain of nearly 6%. The setup generates a much sharper snap-back when the market is already trading below its long-term average.
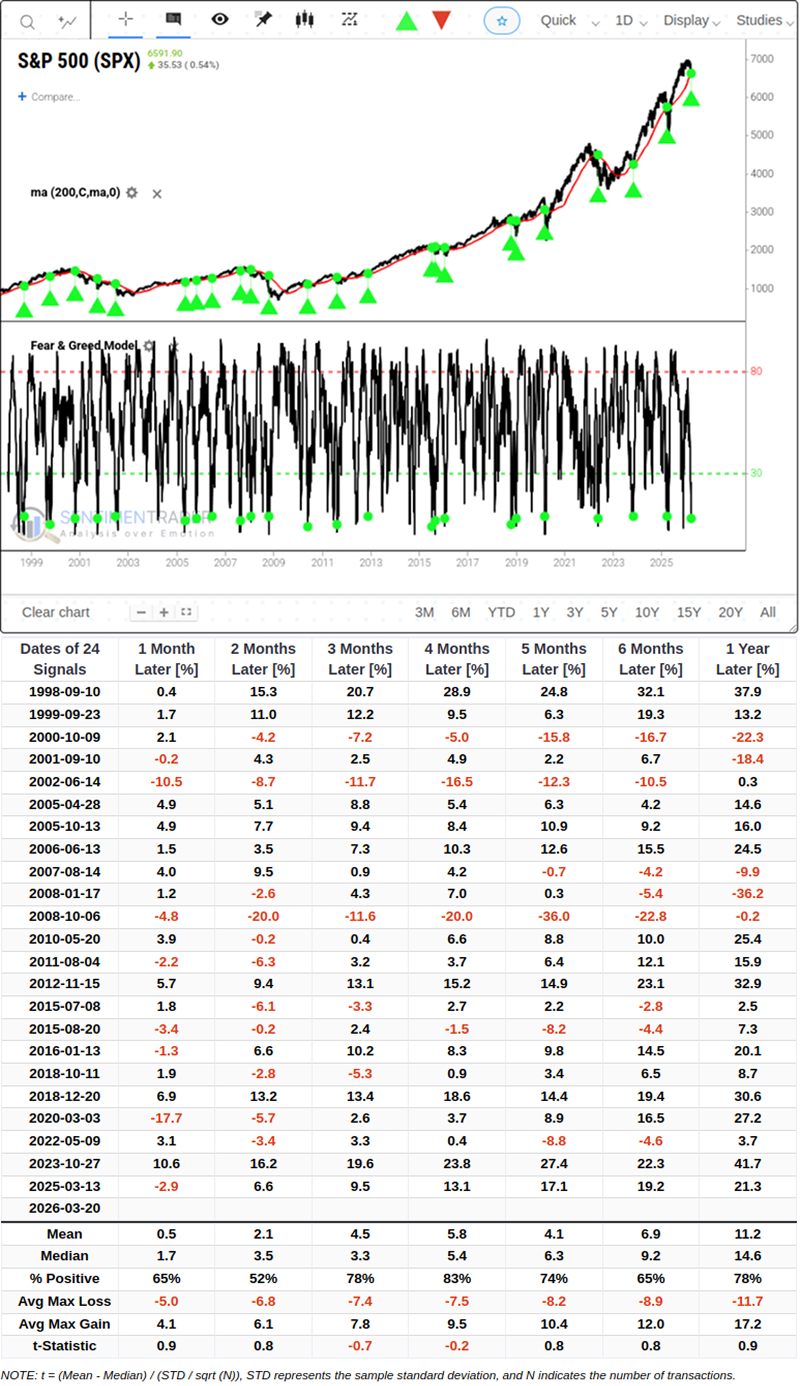
The catch is the immediate volatility. Buyers stepping in early still endured an average maximum loss of roughly 7% over the subsequent months. The destination is historically higher, but the path is brutal.
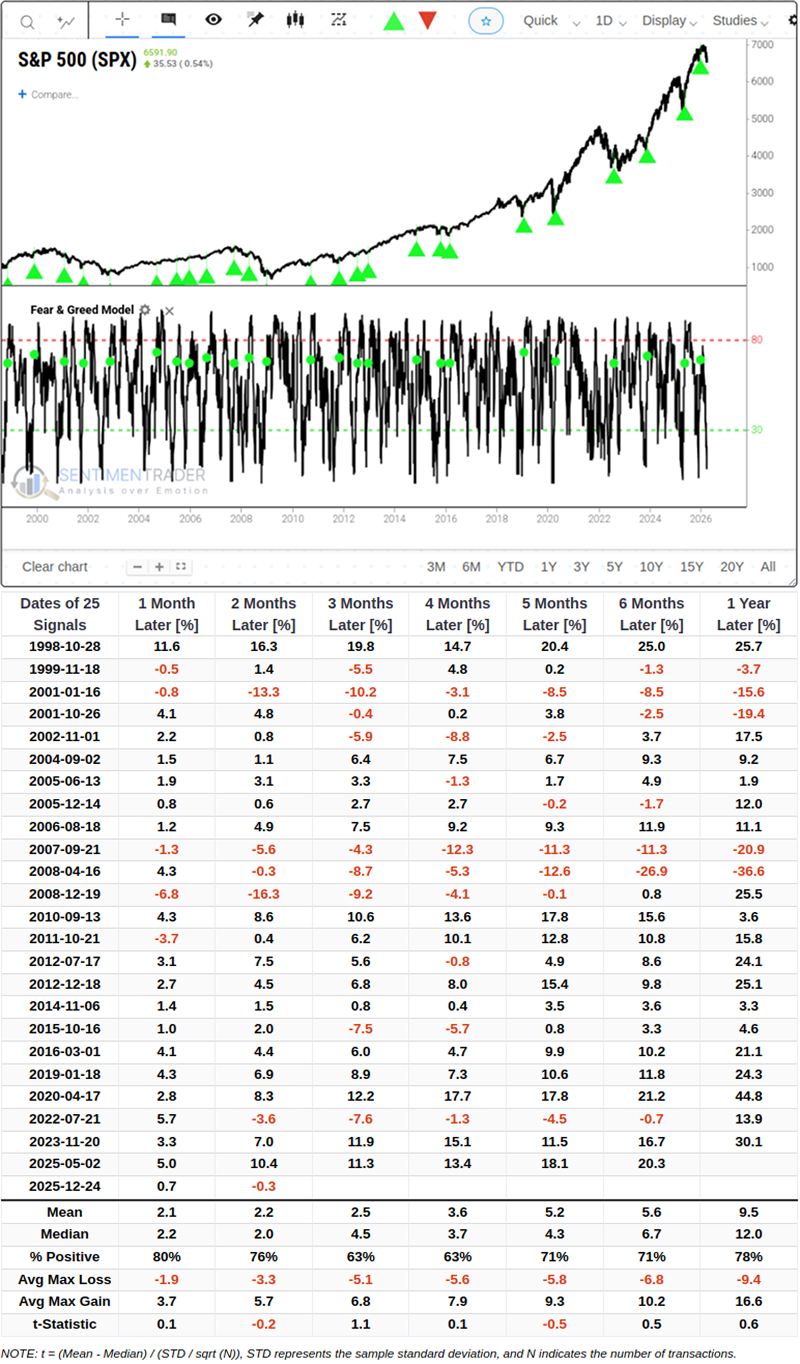
Wait for the Fear & Greed Model to reverse
We conducted a test to assess what level produced the best outlook for the S&P 500 after the Fear & Greed Model declined below 10%, like now. The study returned a reversal above 66% as the optimal threshold with a holding period of 21 and 42 trading days.
What the research tells us...
The Fear and Greed Model dropped to one of the lowest levels in history, indicating fear among traders. Such pessimistic situations tend to occur in substantial market corrections and bear markets. Therefore, it's unsurprising to see the S&P 500 struggle over the following few months, as periods of pessimism can lead to a negative feedback loop. Whether sentiment or breadth-based measures, the best risk/reward setups occur when indicators reverse from an extreme. Patience is paramount in oversold conditions exhibiting pessimism.