
India triggered several breadth thrusts

Key points:
- Several market breadth indicators for the Nifty 50 Index surged, signaling broad participation
- Similar thrusts yielded a favorable outlook for India's benchmark index over a medium-term horizon
- India ETFs have shown notable improvement in relative strength over short-duration time frames
A former emerging market leader appears poised for a comeback
I review the market breadth table on the website each evening, scanning indicators across domestic and foreign indexes to identify potential emerging trends.
One index that stood out to me was India's Nifty Index, which measures the performance of the 50 most liquid and large companies on the National Stock Exchange of India.
Following a peak in September 2024 and a subsequent 15% decline, several indicators measuring Nifty members' participation saw a significant uptick last week, triggering breadth thrusts.
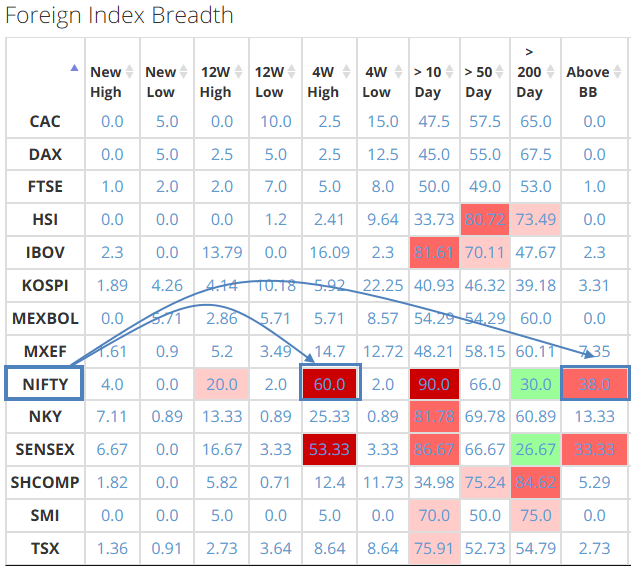
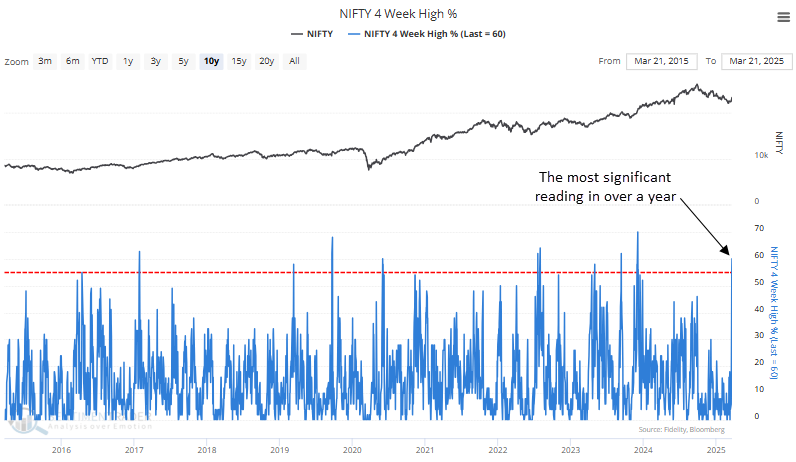
The percentage of Nifty Index members registering a 4-week high surged to 60%, the highest reading since December 2023.
Similar breadth thrusts preceded a positive outlook for the Nifty Index
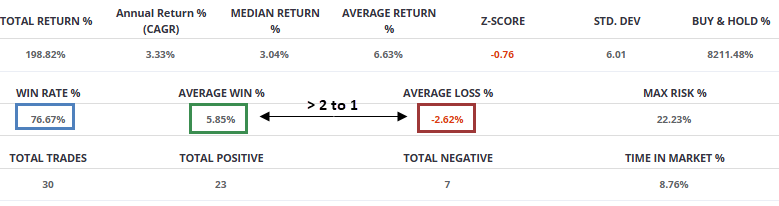
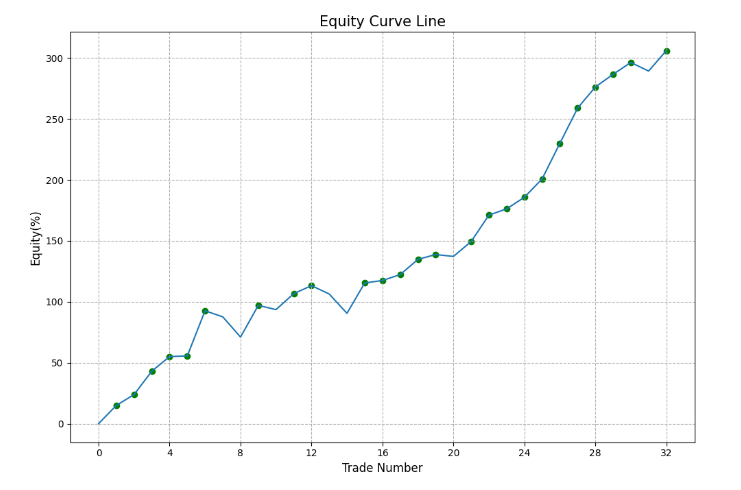
Running an optimization to identify the ideal holding period for the Nifty Index when the percentage of members reaching a 4-week high exceeded 55%, the test returned 25 days. In this case, 23 of the 30 instances were profitable, resulting in a win rate of 76.67%. Furthermore, the average win exceeded the average loss by a ratio of over 2 to 1, a favorable risk/reward scenario.
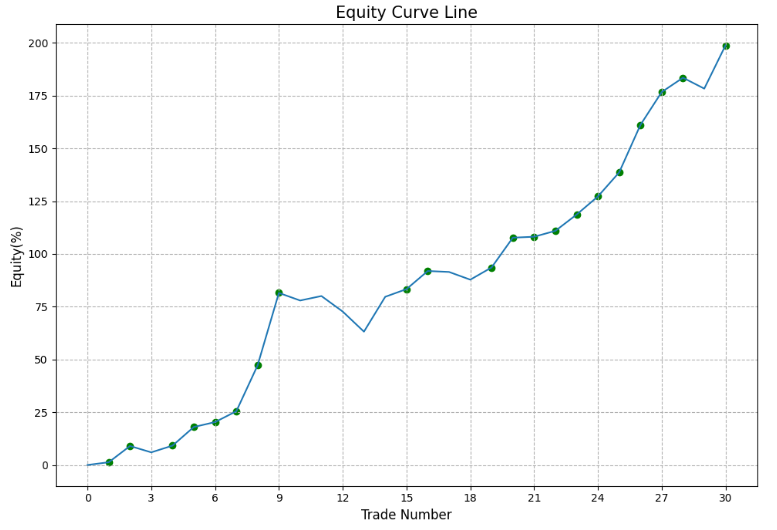
As a rule of thumb, equity curves should ascend gradually from the lower left quadrant to the upper right quadrant of the chart, a scenario primarily accomplished by the 4-week high thrust signal.
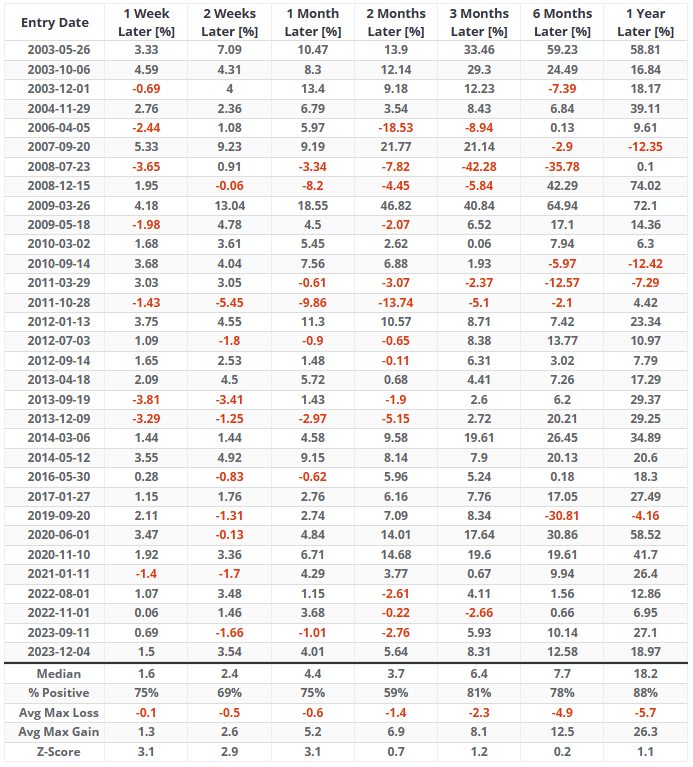
An analysis of prior occurrences over multiple time horizons reveals that broad participation among Nifty index members has typically led to sustained momentum, pushing the index higher 77% of the time over the next three months. More recent cases have been even stronger, with the Nifty gaining in 16 of 17 instances since 2011.
The maximum gain exceeded the maximum loss across all time frames, and this was also the case when measured by the mean or median.
Additional evidence of broad participation
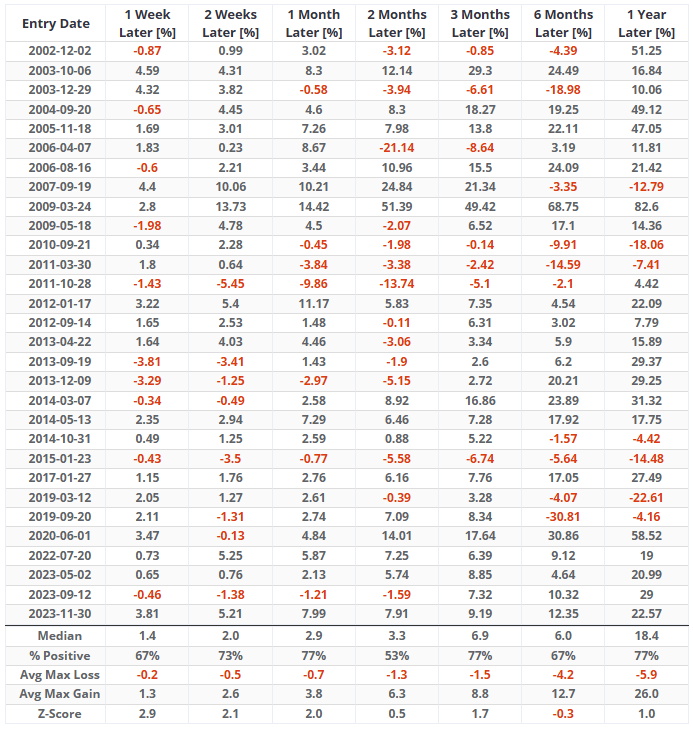
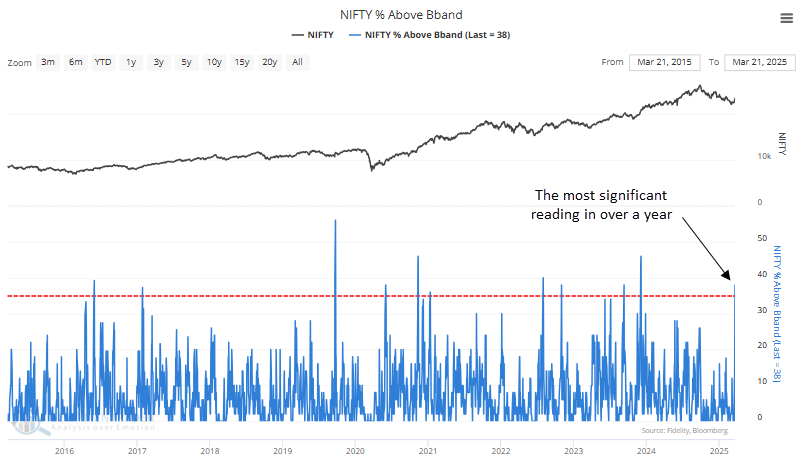
The percentage of Nifty Index members that closed above their respective upper Bollinger Band surged to 38%, the highest point since December 2023.
Testing the ideal holding period for the Nifty Index under conditions where over 35% of members closed above their upper Bollinger Band, an optimized strategy identified 26 days as the best duration. This approach was profitable in 25 of 32 instances, achieving a 78.12% success rate.
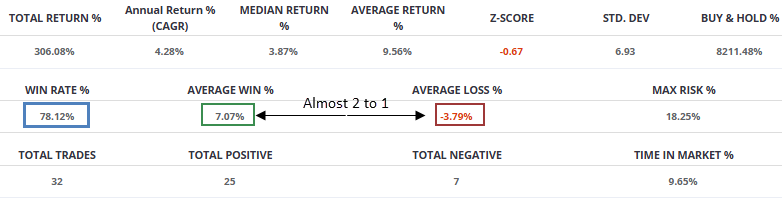
The equity curve for the Bollinger Band thrust signal follows a smooth upward trajectory, rising steadily from the lower left to the upper right-an ideal outcome.
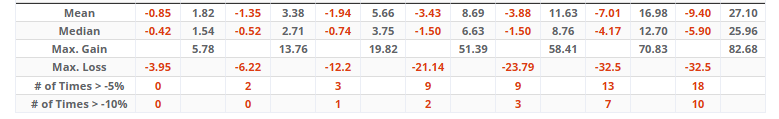
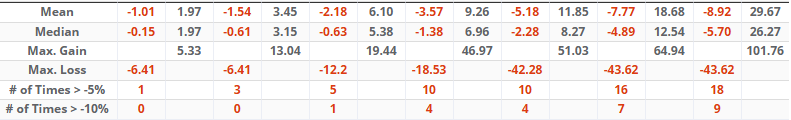
A review of prior occurrences over multiple time horizons reveals that the Bollinger Band thrust signal typically led to sustained momentum, with the index rising 81% of the time over the following three months. This pattern has been even more pronounced in recent years, as the Nifty has gained in 17 of 18 occurrences since 2011.
Mean and median gains outpaced losses across every horizon, highlighting an attractive risk/reward dynamic.
How can one participate in the potential upside?
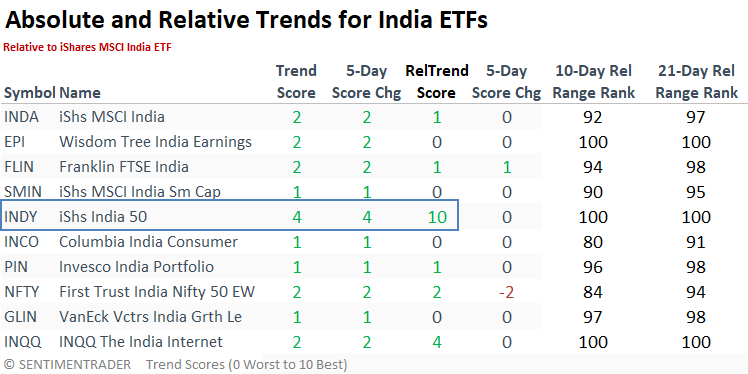
A quick online search uncovered numerous India ETFs. The table below lists the top 10 by AUM. While none currently hold a dominant relative trend score against the S&P 500 due to the long-term nature of these indicators, all exhibit strong short-term relative strength, trading near the upper end of their 10- and 20-day relative ratio range rank.
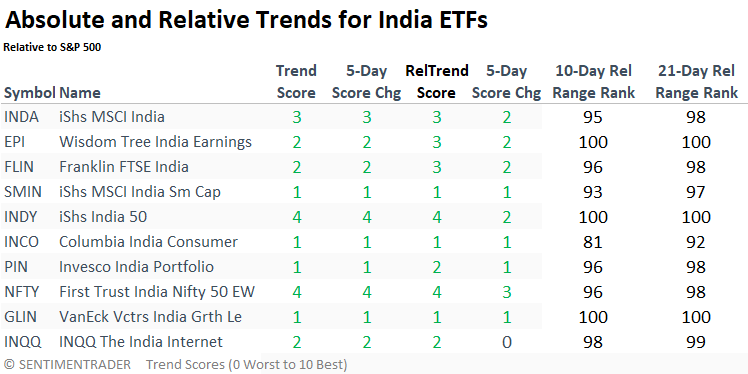
If I replace the S&P 500 with the iShares MSCI India ETF as the benchmark for comparison purposes, the iShares India 50 ETF boasts a relative trend score of 10, easily outpacing all other ETFs. This provides U.S. Dollar-based investors with an accessible way to capitalize on a Nifty Index rally.
What the research tells us...
The Nifty 50, India's benchmark index comprising the 50 largest and most liquid stocks, has recently shown signs of a potential trend reversal following a five-month correction of approximately 15%. This prolonged decline pressured market sentiment, but the index has triggered multiple breadth thrusts. This price momentum signal often marks the transition from bearish to bullish conditions. Historically, such signals have preceded sustained rallies, suggesting that the Nifty may be shifting back into an uptrend as market participation improves and risk appetite returns.