Products
SentimenTrader Trading Tools
‍
Backtest Engine
My Trading Toolkit
Correlation Analysis
Seasonality
Indicators & Data API
‍
Proprietary Indicators & Charts
Market Data API
Strategies & Scanner
‍
50+ Trading Strategies
Smart Stock Scanner
Research Reports
‍
Research Solutions
Reports Library
Free Resources
Simple Backtest Calculator
Simple Seasonality Calculator
The Kelly Criterion Calculator
Sentiment Geo Map
Public Research Reports
Education
Sentiment Indicators
Technical Indicators
Pricing
Company
About
In the News
Testimonials
Client Success Stories
Contact
Log inLoginSign up
< BACK TO ALL REPORTS

Indexes soar, but fewer stocks are coming along for the ride

Jason Goepfert
2020-08-04
Indexes like the S&P 500 and Nasdaq Composite are rallying hard, but fewer of their stocks are able to keep up.

Major indexes, especially those heavy with tech stocks, are driving higher. Yet fewer stocks are coming along for the ride.

We already know how much influence the top 5 stocks are having on the broader indexes, with a record increase in their weighting over the past year. That masked some troubling participation problems a couple of weeks ago and continues to do so now.

Friday's session ranks among the worst-ever for Up Issues and Up Volume when the index gained 0.5% or more. There was a day in April that was even worse, but that was during a historically volatile period, with other days showing massive positive breadth thrusts and recoveries. We're in a dramatically different environment now.

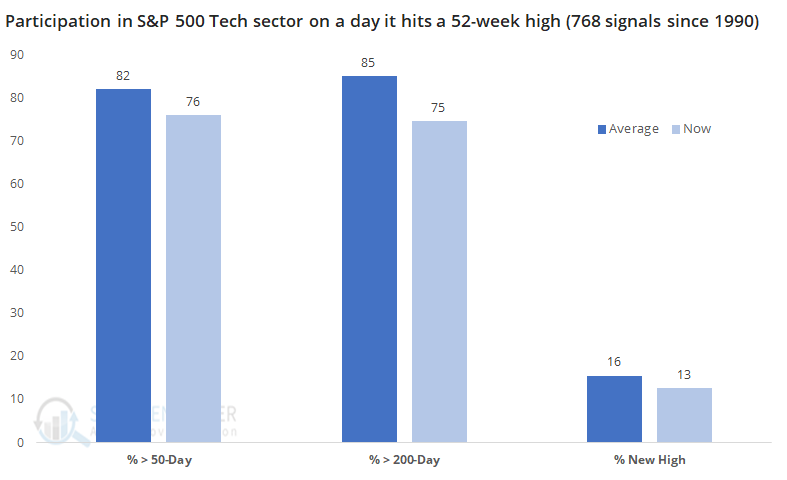
Since 1990, the S&P Tech sector has hit a 52-week high on 768 sessions. On those days, an average of 82% of stocks within the index closed above their 50-day moving averages. On Friday, only 76% of them did. That doesn't seem like a big difference, but it ranks in the bottom 25% of all readings. Same goes for the percentage trading above their 200-day averages. The percentage hitting a 52-week high was also abnormally low.

Breadth on S&P 500 up day

You'll likely hear claims that breadth can't be bad because advance/decline lines are hitting new highs, which means everything is alright. Well, yes it is hitting new highs, but no it doesn't necessarily mean everything is copacetic. That's not an opinion, it's a simple fact that anyone can see if they care to objectively view the data.


This is an abridged version of our recent reports and notes. For immediate access with no obligation, sign up for a 30-day free trial now.

We also looked at:

  • An in-depth look at recent participation vs returns in major indexes
  • SKEW has been trending upward for a while now
  • The Nasdaq 100 has had an incredible streak above its 20-day moving average
PRODUCTS
SentimenTrader
Trading Tools
Indicators & Data API
‍
Strategies & Scanner
‍
Research Reports
FREE
RESOUrCES
Simple Backtest
Calculator
Simple Seasonality
Calculator
The Kelly Criterion
Calculator
Sentiment Geo Map
‍
Public Research Reports
‍
Education
Sentiment Indicators
‍
Technical Indicators
‍
Pricing
Bundle pricing
‍
FAQ
‍
Announcements
‍
COMPANY
‍
About
‍
In the News
‍
Testimonials
‍
Client Success Stories
CONTACT
‍
General Inquiries
‍
Media Inquiries
‍
Financial Professionals Inquiries
‍
© 2026 Sundial Capital Research Inc. All rights reserved.
Setsail Marketing
TermsPrivacyAffiliate Program
Risk Disclosure: Futures and forex trading contains substantial risk and is not for every investor. An investor could potentially lose all or more than the initial investment. Risk capital is money that can be lost without jeopardizing ones’ financial security or life style. Only risk capital should be used for trading and only those with sufficient risk capital should consider trading. Past performance is not necessarily indicative of future results.

Hypothetical Performance Disclosure: Hypothetical performance results have many inherent limitations, some of which are described below. No representation is being made that any account will or is likely to achieve profits or losses similar to those shown; in fact, there are frequently sharp differences between hypothetical performance results and the actual results subsequently achieved by any particular trading program. One of the limitations of hypothetical performance results is that they are generally prepared with the benefit of hindsight. In addition, hypothetical trading does not involve financial risk, and no hypothetical trading record can completely account for the impact of financial risk of actual trading. for example, the ability to withstand losses or to adhere to a particular trading program in spite of trading losses are material points which can also adversely affect actual trading results. There are numerous other factors related to the markets in general or to the implementation of any specific trading program which cannot be fully accounted for in the preparation of hypothetical performance results and all which can adversely affect trading results.

Testimonial Disclosure: Testimonials appearing on this website may not be representative of other clients or customers and is not a guarantee of future performance or success.