Products
SentimenTrader Trading Tools
‍
Backtest Engine
My Trading Toolkit
Correlation Analysis
Seasonality
Market Prediction
Indicators & Data API
‍
Proprietary Indicators & Charts
Market Data API
Strategies & Scanner
‍
50+ Trading Strategies
Smart Stock Scanner
Smart Option Scanner
Research Reports
‍
Research Solutions
Reports Library
Free Resources
Simple Backtest Calculator
Simple Seasonality Calculator
The Kelly Criterion Calculator
Sentiment Geo Map
Public Research Reports
Education
Sentiment Indicators
Technical Indicators
Pricing
Company
About
In the News
Testimonials
Client Success Stories
Contact
Log inLoginSign up
< BACK TO ALL REPORTS

In sync in the Asia-Pacific

Dean Christians
2025-08-19
The Asia-Pacific region, a key hub of global manufacturing, has seen every one of its markets shift above their 200-day averages. Similar recoveries have often preceded a sustainable rally and further confirmed a global bull market.

Key points: 

  • Every MSCI Asia-Pacific country index closed above its 200-day average
  • Similar participation trends bode well for the continuation of the global bull market 
  • Commodities rallied 100% of the time over the subsequent six months

Unanimous participation 

From Seoul to Sydney, Asia Pacific stocks are staging a remarkable comeback.

For the first time since 2021, every single MSCI Asia-Pacific country index is now trading above its 200-day average, reflecting synchronized strength across a region at the heart of global manufacturing. 

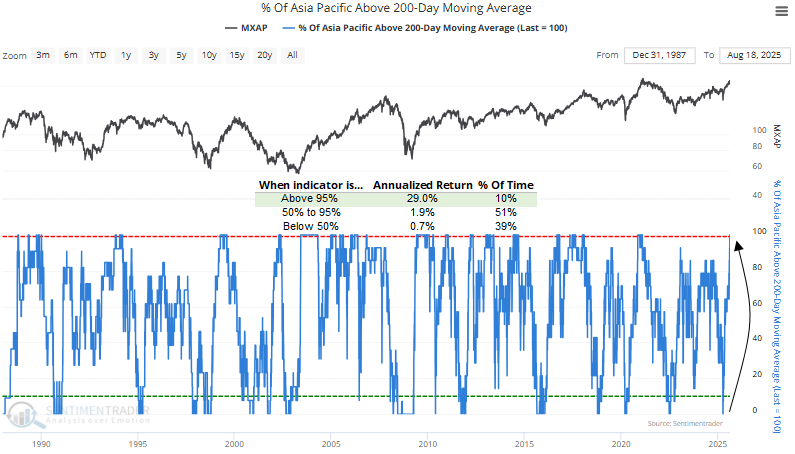
As illustrated in the chart below, when over 95% of Asia-Pacific countries exceeded their 200-day averages, the MSCI Asia-Pacific index has historically delivered an impressive 29% annualized return, significantly outperforming periods below this level. 

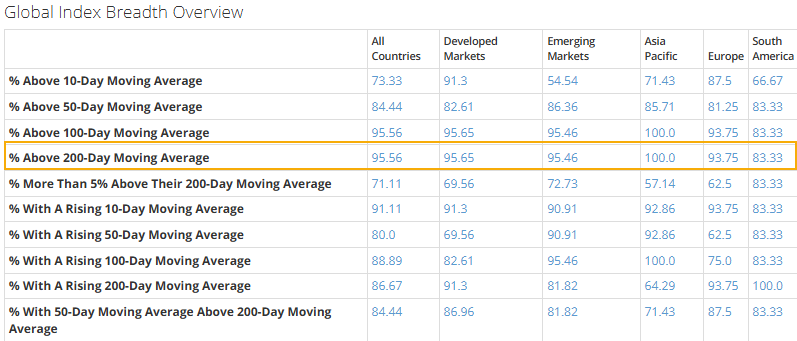
On the Global Breadth Overview page, you can track 35 participation-based indicators built from 45 global indexes and compare them according to developed, emerging, or regions. As seen below, almost all country indexes reside above their 200-day averages.

A favorable backdrop

Similar shifts in long-term participation trends across Asia-Pacific markets have historically set the stage for a regional benchmark index to advance, with positive returns observed roughly 80% of the time over the subsequent six and twelve months. 

The 1999 instance is an interesting analog, as you had a late-cycle catch-up trade following a dismal period for the Asia-Pacific region in a tech-driven bull market.

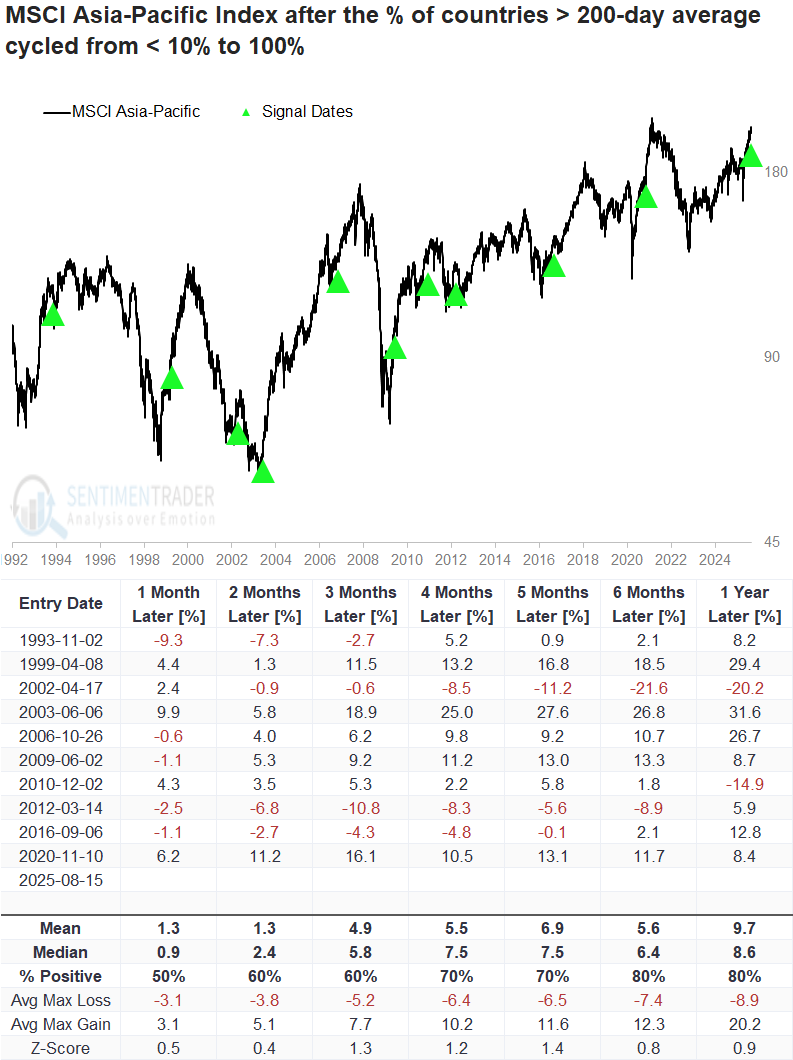
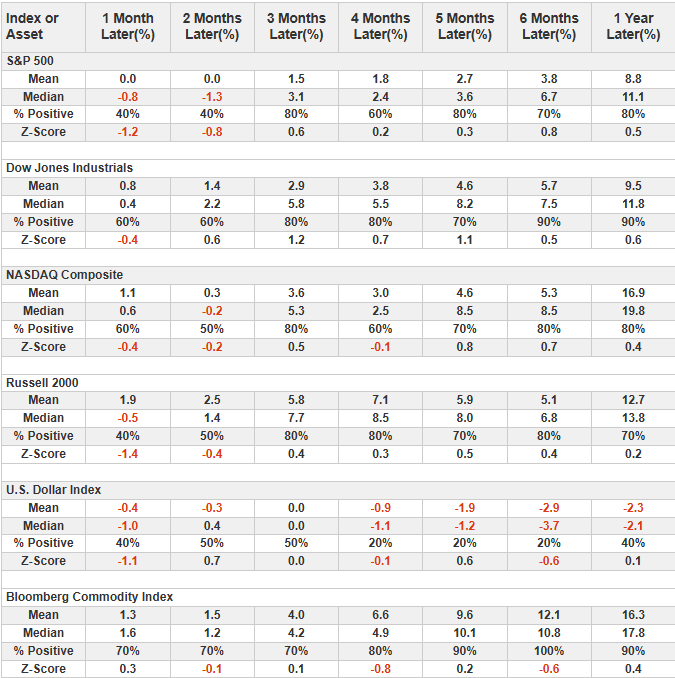
The first few months saw the S&P 500 and other major indices tread water. After the pause, indexes generally moved higher over the next three to twelve months, potentially aided by a weaker dollar. The dollar backdrop also provided a tailwind for commodities, which advanced in all cases over the following six months. 

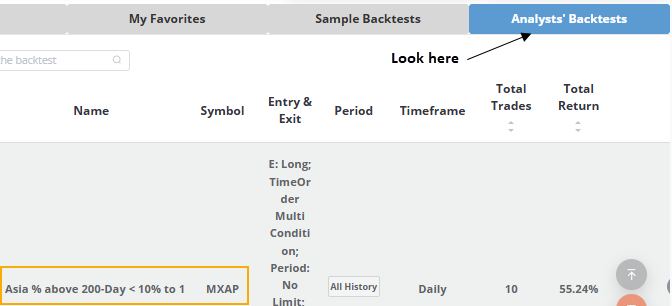
Click here for a link to the study. Additionally, you can find a copy in the Analysts' Backtests section on the website.

What the research tells us...

Global equity markets have seen a meaningful broadening in participation, signaling strength and durability. A key driver of this expansion has been a resurgence in the Asia-Pacific region, where every country index is now trading above its 200-day moving average.

Comparable shifts saw a broad benchmark rally 80% of the time over the subsequent six and twelve months. This synchronized momentum from an area at the core of global manufacturing lends further weight to the case for a sustainable global bull market. The Vanguard FTSE Pacific ETF (VPL) offers access to the region via developed markets.

PRODUCTS
SentimenTrader
Trading Tools
Indicators & Data API
‍
Strategies & Scanner
‍
Research Reports
FREE
RESOUrCES
Simple Backtest
Calculator
Simple Seasonality
Calculator
The Kelly Criterion
Calculator
Sentiment Geo Map
‍
Public Research Reports
‍
Education
Sentiment Indicators
‍
Technical Indicators
‍
Pricing
Bundle pricing
‍
FAQ
‍
Announcements
‍
COMPANY
‍
About
‍
In the News
‍
Testimonials
‍
Client Success Stories
CONTACT
‍
General Inquiries
‍
Media Inquiries
‍
Financial Professionals Inquiries
‍
© 2026 Sundial Capital Research Inc. All rights reserved.
Setsail Marketing
TermsPrivacyAffiliate Program
Risk Disclosure: The information and tools provided are for research and analytical purposes only and are not intended as investment advice. Market analysis involves uncertainty, and outcomes may differ from expectations. Users should conduct their own due diligence and consider their individual circumstances before making any financial decisions. Past performance is not necessarily indicative of future results.

Hypothetical Performance Disclosure: Hypothetical performance results have many inherent limitations, some of which are described below. No representation is being made that any account will or is likely to achieve profits or losses similar to those shown; in fact, there are frequently sharp differences between hypothetical performance results and the actual results subsequently achieved by any particular trading program. One of the limitations of hypothetical performance results is that they are generally prepared with the benefit of hindsight. In addition, hypothetical trading does not involve financial risk, and no hypothetical trading record can completely account for the impact of financial risk of actual trading. for example, the ability to withstand losses or to adhere to a particular trading program in spite of trading losses are material points which can also adversely affect actual trading results. There are numerous other factors related to the markets in general or to the implementation of any specific trading program which cannot be fully accounted for in the preparation of hypothetical performance results and all which can adversely affect trading results.

Testimonial Disclosure: Testimonials appearing on this website may not be representative of other clients or customers and is not a guarantee of future performance or success.