
In case SPY pulls back...

Key Points
- The S&P 500 has enjoyed a terrific run since the October 2023 low but is now entering an unfavorable seasonal period
- An option strategy known as the out-of-the-money butterfly spread offers speculators a way to play the short side and longer-term investors the opportunity to hedge their stock portfolio
- The keys to using this strategy are understanding how it works - and also its limitations
SPY has enjoyed a run, but…
The SPDR Trust (ticker SPY) enjoyed a runup of almost +22% after bottoming in October 2023. However, a purportedly bearish divergence between price action and the 14-day RSI has formed recently. This sometimes presages at least a short-term pullback in stock prices.
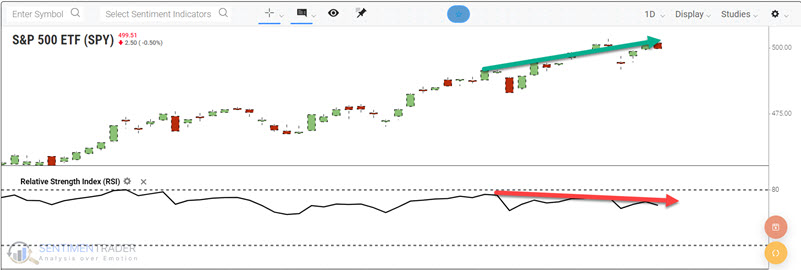
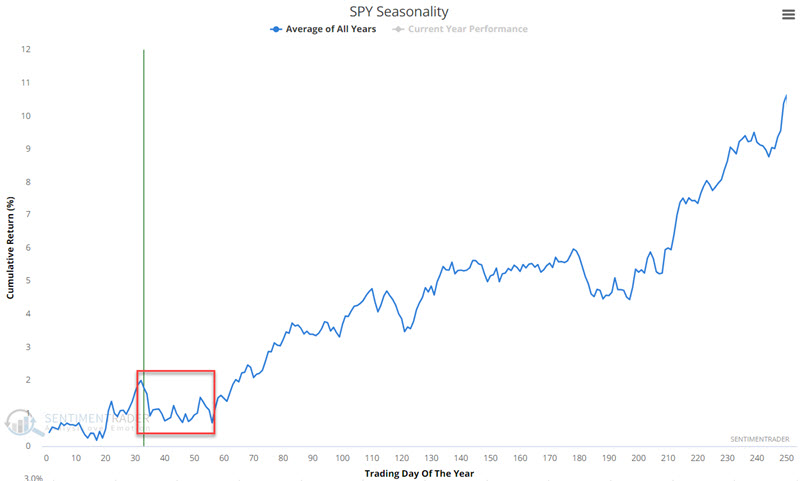
SPY is also in the early portion of an often-unfavorable time of year, as shown in the chart below. Except for the fierce 2020 COVID-19 selloff, when this period shows weakness, it typically is a choppy affair with a moderate pullback by the major market averages.
So, what should investors and traders do? As always, there are choices. If a long-term investor expects only a moderate pullback before another leg higher, the easiest is to do nothing. Just ride it out and wait for the next upleg. However, another investor might consider entering a hedge to attempt to offset some or all of any anticipated pullback. Likewise, a speculator might be interested in playing the short side and trying to profit from a short-term decline.
The out-of-the-money butterfly Spread (hereafter referred to as an OTM butterfly) is an option trading strategy that can allow both of the above to achieve their objectives.
The OTM Butterfly as a bearish speculation
An OTM put butterfly spread involves buying a put option at one strike price, selling two puts at a lower strike price, and buying one more put at an even lower strike price. Typically, the distance between the strike price will be uniform. Also, a "standard" butterfly spread is entered in a 1x2x1 ratio (long one higher strike price put, short two lower strike price puts, and long one even low strike priced put). An OTM butterfly involves puts that are all "out-of-the-money," i.e., the strike prices of all put options involved are below the stock's current price when the trade is entered.
Let's assume a speculative trader anticipates that SPY will decline over the next four weeks but does not expect a market "crash" - just a standard pullback of 1 to 2 standard deviations. Based on this outlook, our example trade is entered as follows:
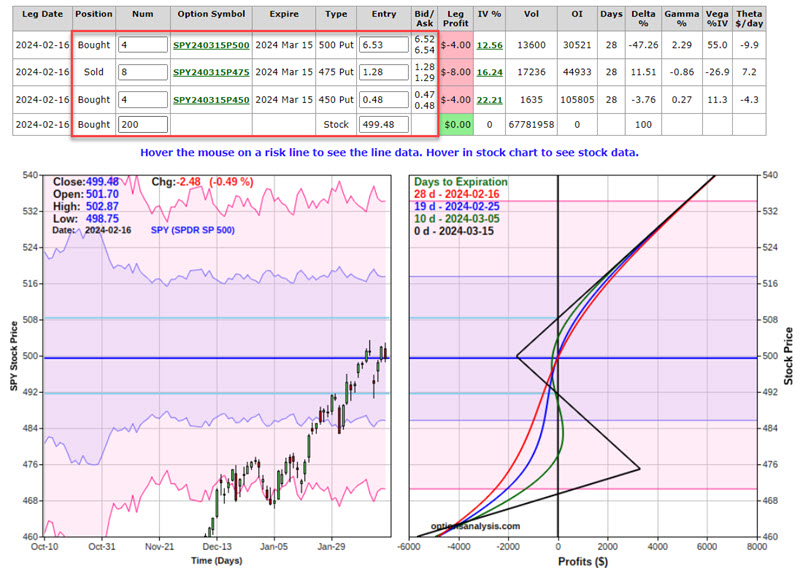
- Buy 4 SPY Mar 15, 2024, 500 strike price puts @ $6.54
- Sell 8 SPY Mars15 2024, 475 strike price puts @ $1.28
- Buy 4 SPY Mar 15 2024 450 strike price puts @ $0.48
The particulars for this position appear below (all subsequent screenshots are courtesy of Optionsanalysis.com). To enter a 4x8x4 position costs $1,780.
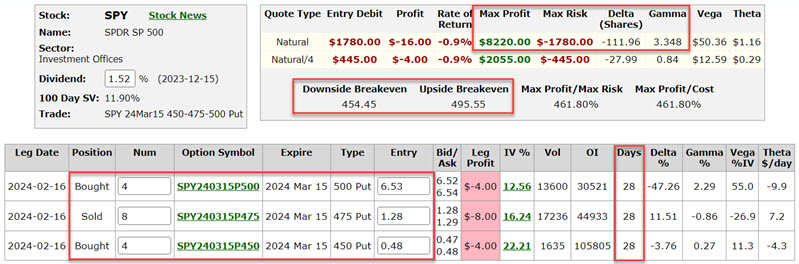
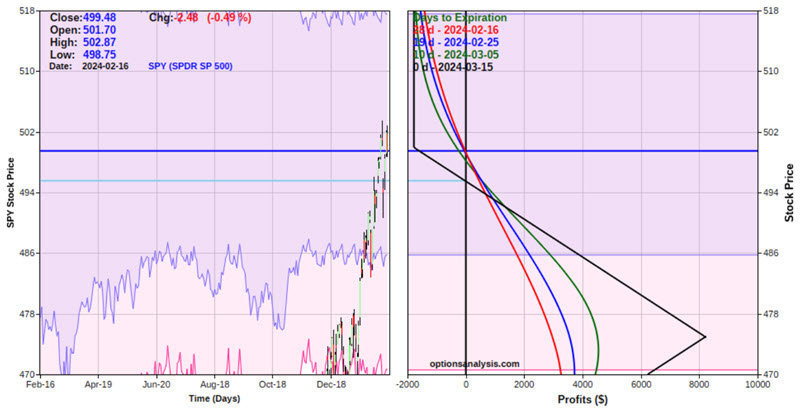
The risk curves (i.e., the expected P/L for the option position at a given price for SPY shares on different dates leading up to option expiration) appear in the right-hand box below.
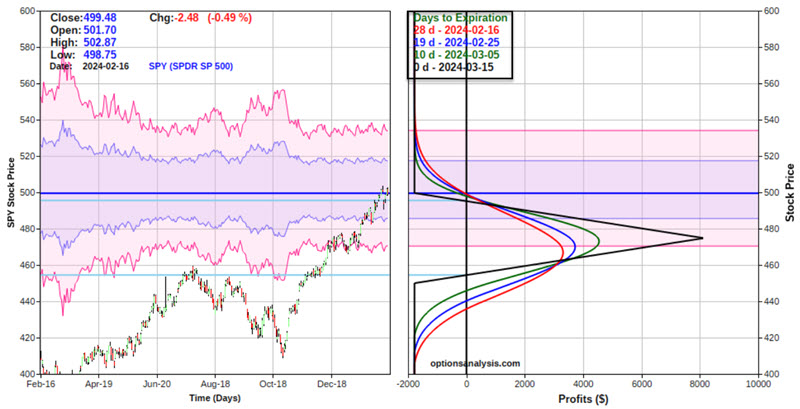
As you can see, the trade can quickly become quite profitable if the price of SPY shares declines, BUT, if SPY shares fall below the middle strike price of $475, the risk curves "roll over" and begin to decline. Bottom line: A trader who wanted to hedge against an outright market crash would choose a different position.
Let's "zoom in" on the risk curves to highlight "where this trade lives." The chart below covers a price range from one standard deviation higher ($518 per share) to two standard deviations lower (roughly $470 a share).
Things to note:
- The cost to enter the position - and the maximum risk - is $1,780. This loss would occur if the position were held until expiration and SPY shares were either above the upper strike price of $500 or below the lower strike price of $450
- The position starts with a "Delta" of -111.96 and a "Gamma" of 3.348. This means that at the outset, the trade is roughly equivalent to holding short 112 shares of SPY (without the unlimited risk associated with holding a short position in the shares). If SPY gains $1 in price, the position Delta will increase by 3.348 and vice versa
- The breakeven prices basis SPY shares are $454.45 and $495.55 (with SPY between these two prices, the position should be expected to show a gain. Outside of this range, losses will likely accrue)
The speculator is hoping for a decline in the price of SPY shares in the next four weeks. A sizeable percentage profit can accrue as long as SPY experiences an orderly decline.
That said, the speculator must make the following decisions:
- When to exit or adjust the original position with a profit
- When to exit the trade with a loss
The reality is that there are no "correct" answers to those questions. That said, the trade should almost certainly be adjusted or exited if SPY shares approach the middle strike price of $475 a share - since that is the point where the risk curves will "roll over."
The OTM Butterfly as a hedge
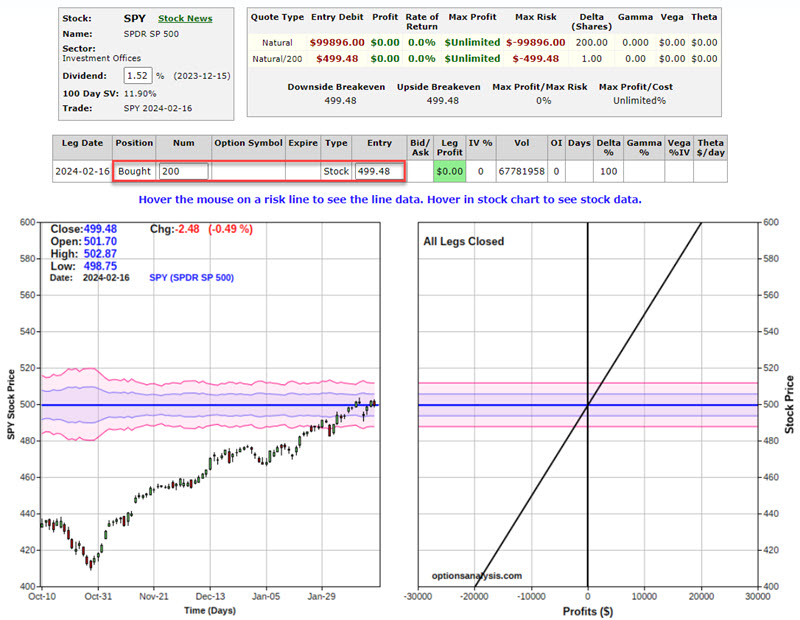
The same example position we discussed above can also serve as a hedge to an existing portfolio. Let's assume that an investor owns 200 shares of SPY, with the shares trading at $499.48. This position is reflected in the figure below. Note that the "risk curve" is a straight line because for each $1 SPY move up or down, the position gains or loses $200.
The chart below overlays the long 200-share stock position risk curve with the risk curves for the OTM butterfly shown above. The cost of the option spread is roughly 1.8% of the value of the shares ($1,780 to buy the OTM butterfly spread divided by the share value of $99,896). If the price of SPY declines, the 200-share position (the straight black line) loses money. However, down to $475 a share, the risk curves for the OTM butterfly gain value. This gain in the option spread would offset some of the loss in the SPY shares.
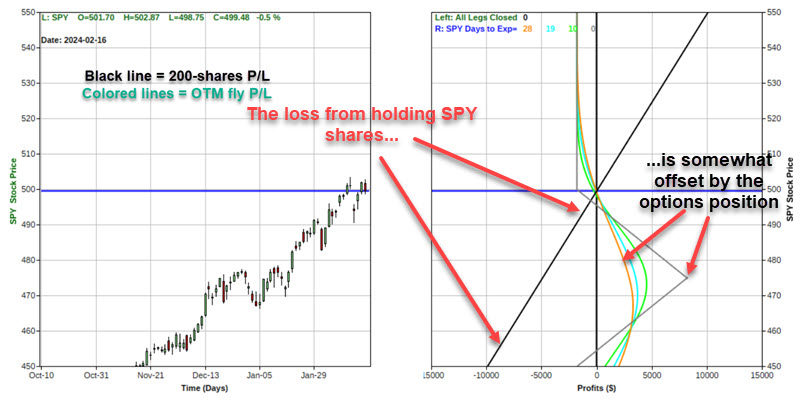
If the price of SPY declines, the 200-share position (the straight black line) loses money. However, down to $475 a share, the risk curves for the OTM butterfly gain value. This gain in the option spread would offset some of the loss in the SPY shares.
The figure below displays the particulars and risk curves for the combined positions.
The bottom line:
- If SPY shares rally higher, the investor holding the hedge will make a lower profit equal to the cost of the hedge (more on this in a moment)
- If SPY shares fell as far as $475 a share, the stock shares investor would lose roughly -$5,000 (200 shares x -$25 a share). Depending on whether the decline occurred quickly or over time, the hedged trader could experience anything from a loss of (only) -$1,828 (if the decline was immediate - see the red line in the chart above) to a gain of roughly $3,180 (if SPY was trading at $475 at option expiration)
To compare apples to apples, the chart below displays the risk curve for the 200-shares of SPY position (straight black line) and the hedged position (gray line) at option expiration.
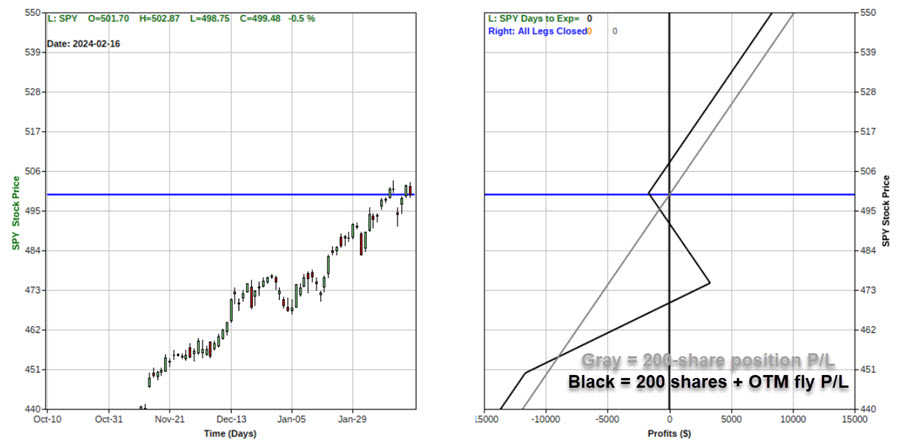
In sum:
- Above roughly $496.33 a share, the hedged position will underperform the long 200-share position by the cost of the OTM butterfly spread
- Between approximately $455 and $496.33 a share, the hedged position will lose less than the 200-share position
- Below roughly $455 a share, this particular hedged position can lose more than the 200-share position
The OTM butterfly spread highlighted above is not a "set it and forget it" position - whether entered as a speculation or a hedge.
What the research tells us...
The out-of-the-money butterfly spread is a versatile strategy that speculators or investors can use. However, it is essential to understand the costs, pros and cons, and the potential need for decisive action if a critical price for the underlying shares is reached before option expiration. The example trade above should not be considered a "recommendation" but merely an example of how a particular option strategy can create new opportunities.