
In a healthy tape, some nascent warning signs begin to trigger

Key points:
- Stock indexes were holding near highs, but more stocks recently fell to 52-week lows than hit 52-week highs
- Behavior like this across exchanges has started to trigger technical warnings
- The largest reason for these warnings is lagging Small Caps, which isn't necessarily a concern by itself
As the indexes soar, a few worries to watch
One core tenet of a healthy market environment is that the percentage of stocks reaching a 52-week high in an index or on an entire exchange should outnumber those falling to a 52-week low. Just using that net metric can be a helpful guide for the magnitude of future returns.
When more stocks on the NYSE hit 52-week highs than lows, the S&P 500's annualized return was +10.8% since 1965. When there were more lows than highs, that annualized return got chopped more than in half.
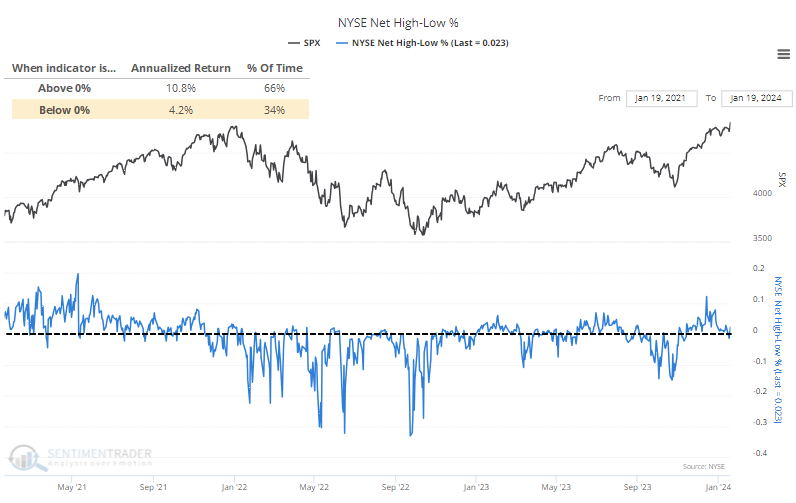
The streak of more highs than lows ended late last week, though it bounced right back above the zero line, which is what healthy markets do.
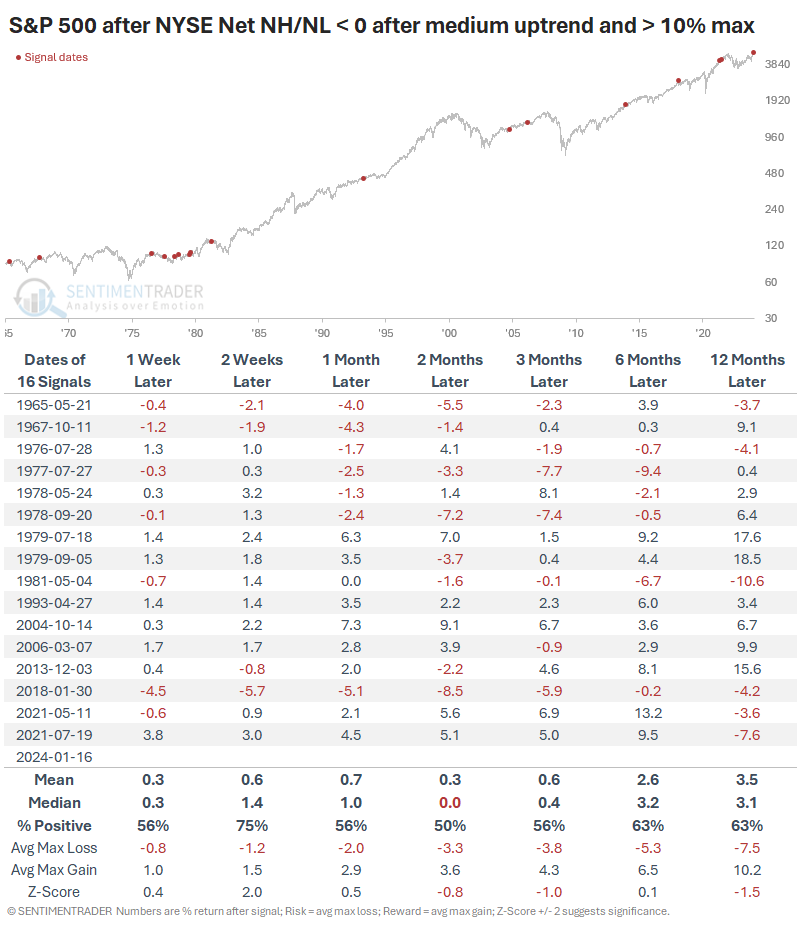
Still, the streak had lasted a moderate length of time, and at one point during the streak, there were at least 10% more stocks at highs than lows. The table below shows how the S&P performed after the ends of similar streaks. It wasn't too bad overall, but it wasn't great, either - the median return over the next two months was just below 0%.
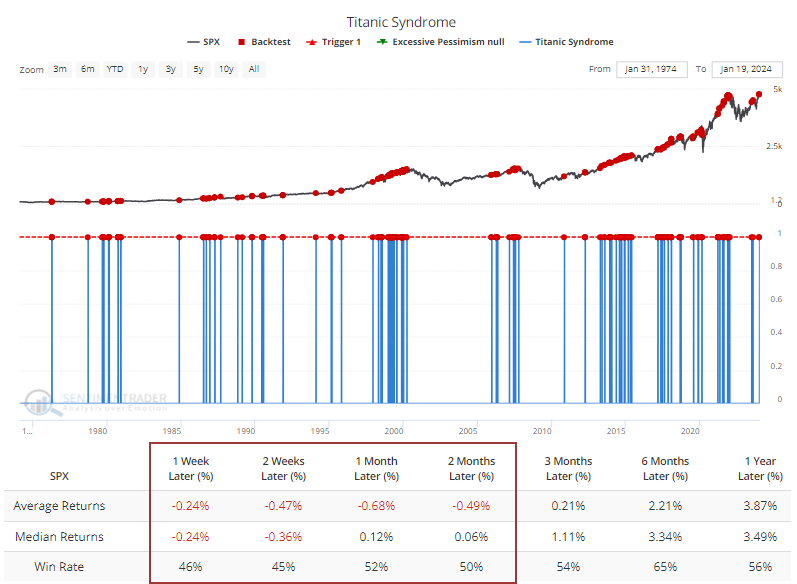
The fact that more stocks fell to 52-week lows than rose to 52-week highs so soon after the S&P scored a 52-week high also triggered a Titanic Syndrome warning. Technical warnings like this tend to be more effective if there is a cluster, but the Backtest Engine shows that even a single warning tends to lead to poor short- to medium-term returns.
Smaller stocks are still struggling
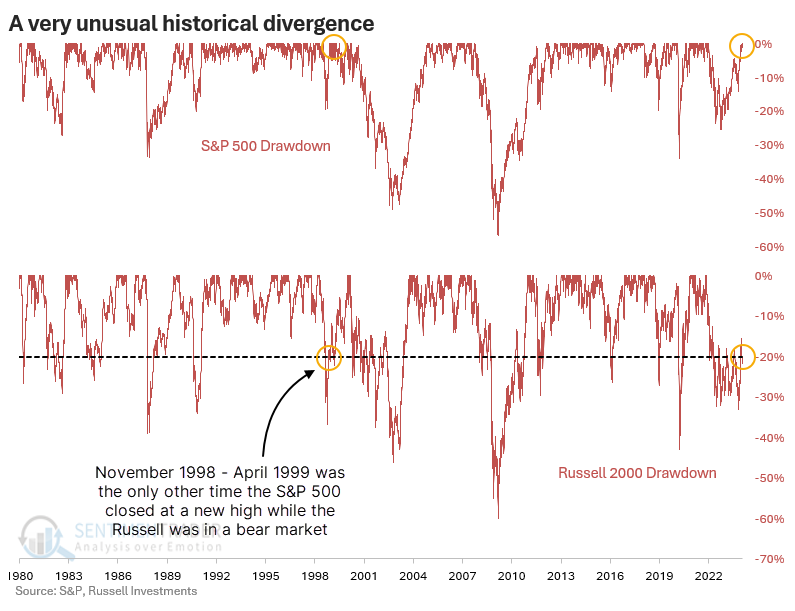
The main reason for the poor showing in 52-week lows versus highs is smaller stocks. Even though the S&P 500 recorded an all-time high on Friday, the Russell 2000 was still in a bear market, down more than -20% from its own high.
That has never happened before.
The only time there was a similar divergence between the S&P and Russell 2000 was in 1998-1999. At that time, the Russell was more than 19% off its high. While stocks continued to rise for quite a while after the divergence, it did not end well in the long term.
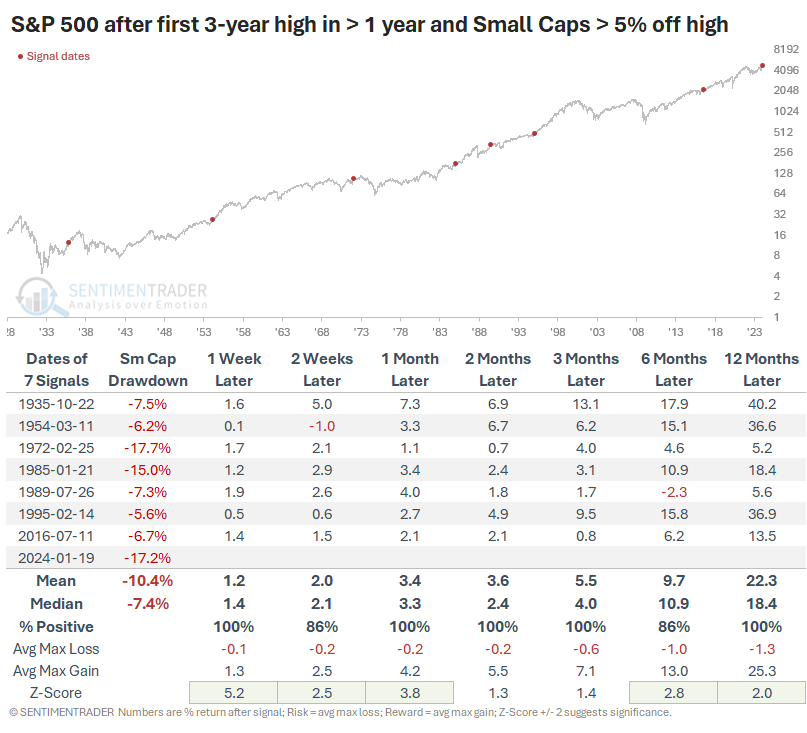
Using a total return index for Small Caps, the table below shows other times when the S&P 500 closed at least at a 3-year high, but Small Caps were at least 5% off their own high.
Crucially, the table filters the dates to those times when it was the first S&P new high in at least a year; true breakouts that could jolt investor sentiment. The 1998-99 period doesn't show up because the S&P had been hitting new high after new high leading up to then. Surprisingly, there was no ill effect up to a year later despite small-cap stocks lagging so badly.
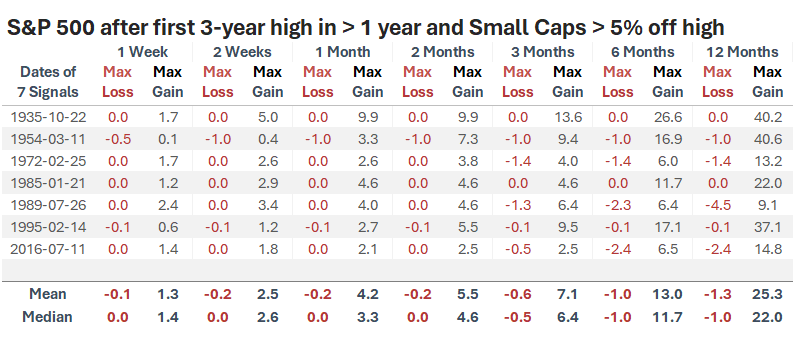
Even the worst divergences in 1972 and 1985 didn't lead to significant drawdowns. The table below shows the maximum gains and losses across time frames after these signals. Remarkably, none of them saw more than a -4.5% drawdown at any point within the following year.
What the research tells us...
There are starting to be some worrying signs underneath the strong performance of the indexes, as we're back in an environment where a few super strong large stocks can sway entire indexes. It has triggered nascent warning signs in some technical indicators, but nascent signs don't matter much in a mostly healthy tape. If they persist for weeks, we'll have a better case for worrying about the sustainability of the advance.
One reason why these warnings may not matter as much this time around is that it is primarily due to lagging small-cap stocks. While they may be more sensitive to economic forces and thus assumed to be an especially effective warning for the broader market, it hasn't panned out that way before. When the S&P 500 reached new highs while Small Caps lagged badly, it had no ill impact on forward returns whatsoever.